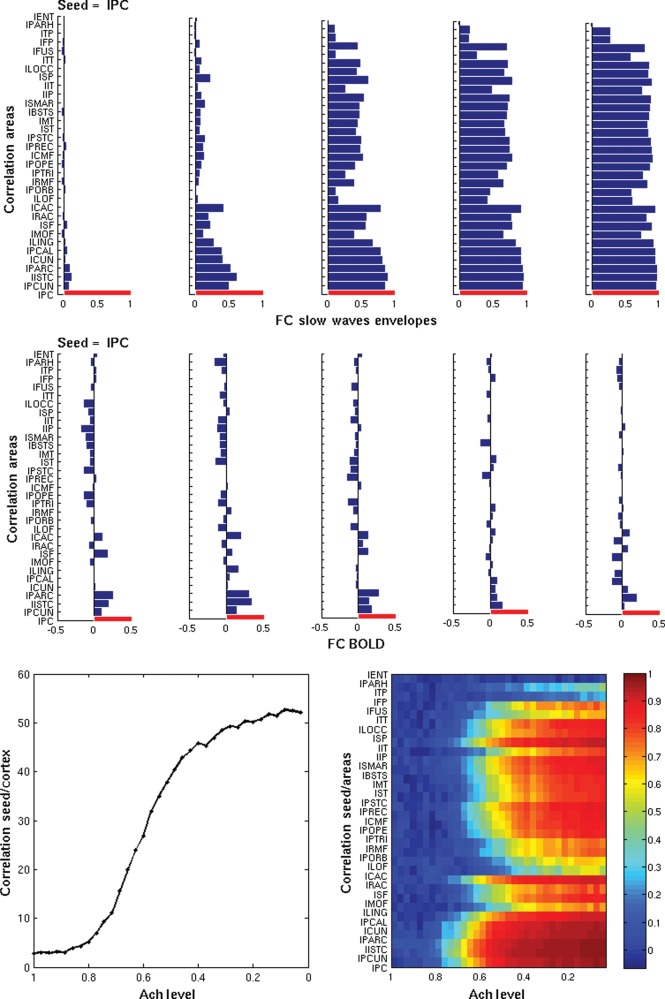
Figure 4.
Temporal correlation of the slow sleep envelopes (based on the firing rates) between different nodes and of the BOLD signal. First row top panels: Correlation of the envelopes of the slow sleep waves between a specific seed (left posterior cingulate, lPC) and all cortical areas, for 5 snapshots corresponding to different levels of Ach (ζ = 0, 0.42, 0.57, 0.71, and 1, from left to right, respectively). Second row panels: Correlation of the underlying fMRI BOLD signal, for the same seed and for the same 5 snapshots. Only half hemisphere is shown. Bottom panels (left): Total correlation (summed over all areas) between the envelopes of the slow sleep waves for the same seed as a function of the Ach level. Bottom panel (right): Correlation between the envelopes of the slow sleep waves for each cortical area and for the same seed as a function of the Ach level.

