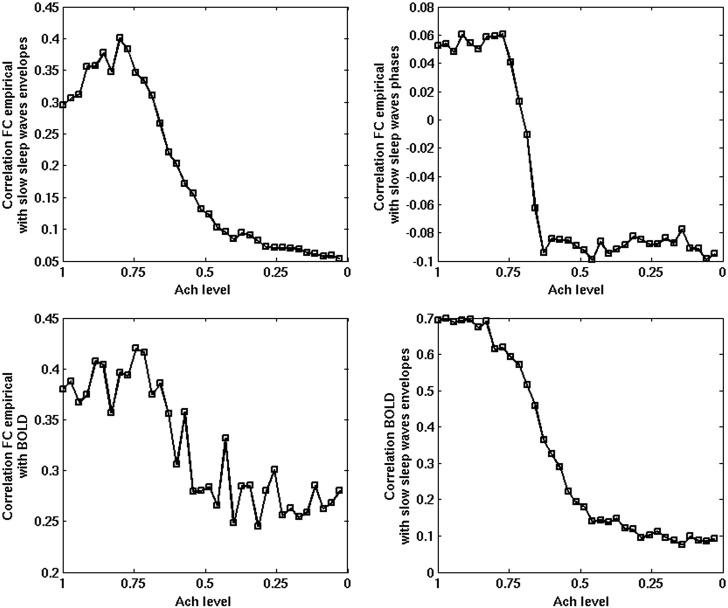
Figure 6.
Top left panel: Correlation between the experimentally obtained resting-state BOLD FC (wakefulness only) and the envelopes of the slow sleep waves as a function of sleep stage. Top right panel: Correlation between the phases of the slow sleep waves and the same empirical resting-state BOLD FC. Bottom left panel: Correlation between the empirical and the simulated BOLD FC. Bottom right panel: Correlation between the simulated BOLD signal and the envelopes of the slow sleep waves. During awakening (increasing the Ach level), the correlation between slow sleep waves gets more shaped according to the resting-state FC.

