
Figure 6. The CLSY1/2 and CLSY3/4 proteins regulate Pol-IV in connection with repressive chromatin marks.
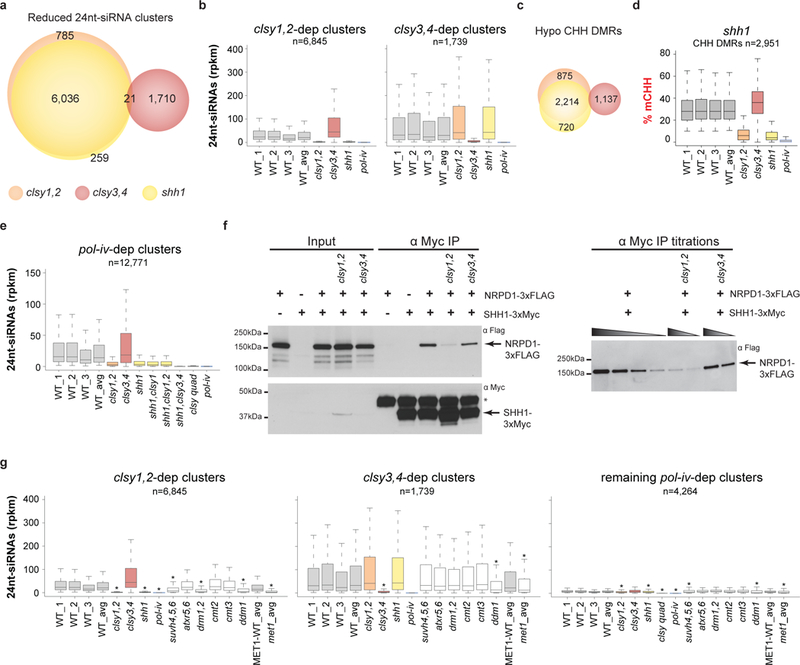
(a and c) Scaled Venn diagrams of reduced 24nt-siRNA clusters and hypo CHH DMRs, respectively, showing the relationships between loci regulated by the shh1 single and clsy1,2 or clsy3,4 double mutants. For readability, only overlaps >20 are labeled. (b, e and g) Boxplots showing the levels of 24nt-siRNAs at the reduced 24nt-siRNA clusters identified in the clsy double mutants, b and g, or pol-iv single mutant, e, in the genotypes indicated below. In g, the asterisks (*) indicate a p-value <2.2e−16 calculated using a Wilcoxon sum test relative to the WT_avg control for all samples except for met1, which was calculated relative to the MET1-WT control. The p-values for all other samples are >0.05. These boxplots represent a single experiment including three independent WT controls. (d) Boxplot showing the levels of CHH methylation at the hypo CHH DMRs identified in the shh1 single mutant as compared to the clsy double mutants and pol-iv. This boxplot represents a single experiment including three independent WT controls. (f) Cropped Western blots showing the levels of NRPD1–3xFLAG or SHH1–3xMyc from co-immunoprecipitation (co-IP) experiments in the genetic backgrounds indicated above each lane. For each blot the antibody (α) used is indicated in the upper right corner and the sizes of the protein markers are indicated on the left. An asterisk (*) marks a background band present in the α-Myc IP and the bands corresponding to the NRPD1–3xFLAG and SHH1–3xMyc proteins are marked with arrows. For the IP titrations, the gradient triangles represent a series of 2-fold dilutions starting from undiluted IP samples. Uncropped images are shown in Supplementary Fig. 8.