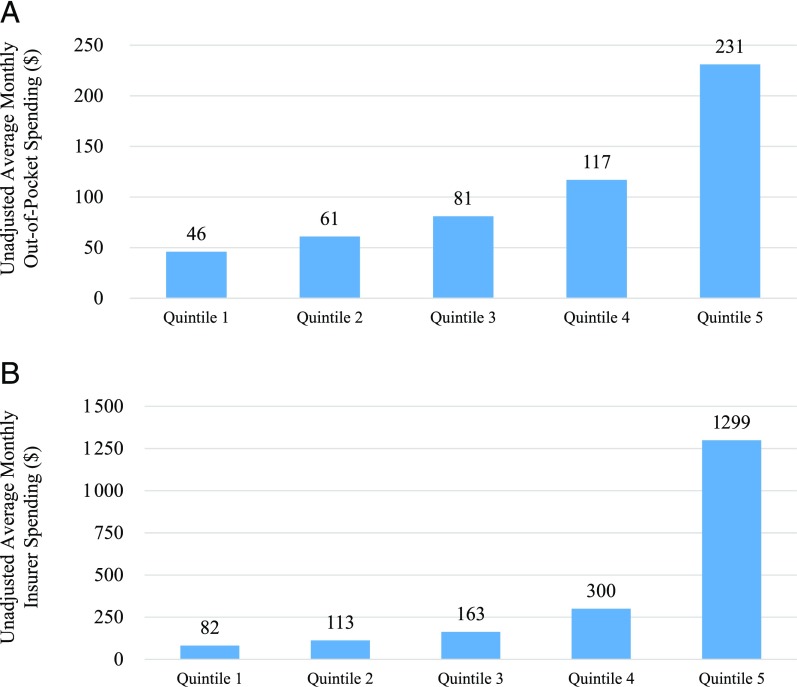
FIGURE 1.
A, Unadjusted average monthly out-of-pocket spending for ASD-specific services by spending quintile, 2008–2012. B, Unadjusted average monthly insurer spending for ASD-specific services by spending quintile, 2008–2012. The final sample included 106 977 children. Quintiles were determined by average monthly spending on ASD-specific services in any month between 2008 and 2012; quintile 1 refers to the lowest spenders.

