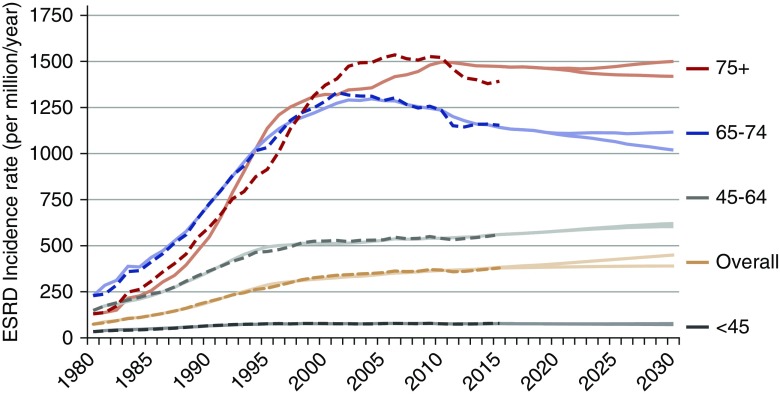
Figure 3.
Age-specific incidence rates have leveled off. Annual ESRD incidence rate (per million per year) from 1980 to 2030 by age, with two assumptions about the projected trend in obesity prevalence after 2012. Dashed lines represent reported data, and solid lines represent simulated data. Incident counts are from the US Renal Data System RenDER system13 (accessed January 2016). Population counts are from smoothed Centers for Disease Control and Prevention–bridged US Census data. Simulation results are on the basis of increasing obesity trend versus decreasing obesity projections.

