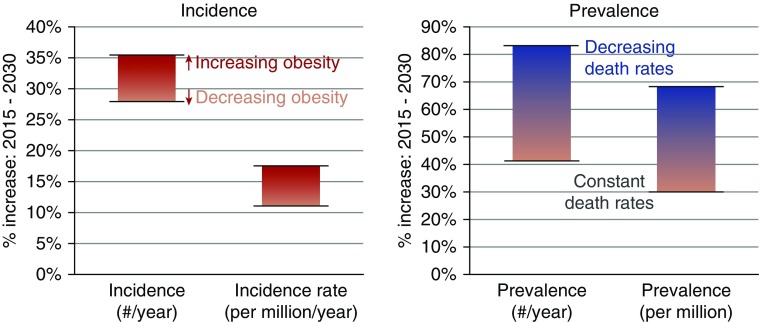
Figure 5.
ESRD incidence and prevalence should rise by 2030. Ranges of projected increases in incidence/prevalence. Each bar represents the range of results across four sets of simulations, each with a different set of assumptions. The range of projected incidence and incidence rates are shown on the basis of the increasing obesity versus decreasing obesity assumptions. Separate bars are shown for the prevalence under differing assumptions about the ESRD death rates (constant versus decreasing death rates); the obesity assumptions made smaller differences in ESRD prevalence.

