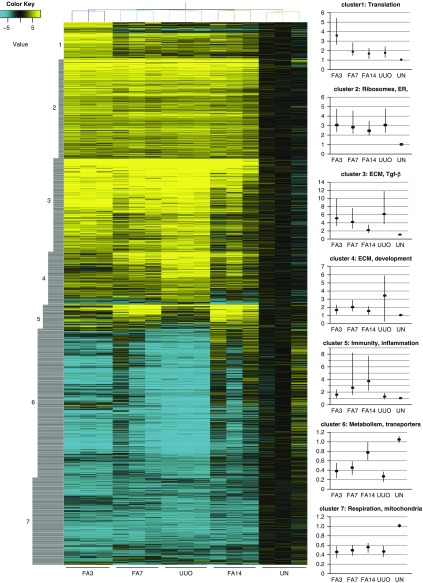
Figure 4.
Gene expression changes in isolated fibroblasts after renal injury exhibit distinct clustering. The normalized relative expression values for 2640 Affymetrix probe sets that show statistically significant changes in at least one of the renal disease models were clustered. The graphs on the left show mean expression values for individual clusters (dots) with the 25th and 75th percentiles represented by the vertical lines. The complete dataset with gene names is available as a supplemental Excel file (Supplemental Table 2). ER, Endoplasmic reticulum; UN, Uninjured.

