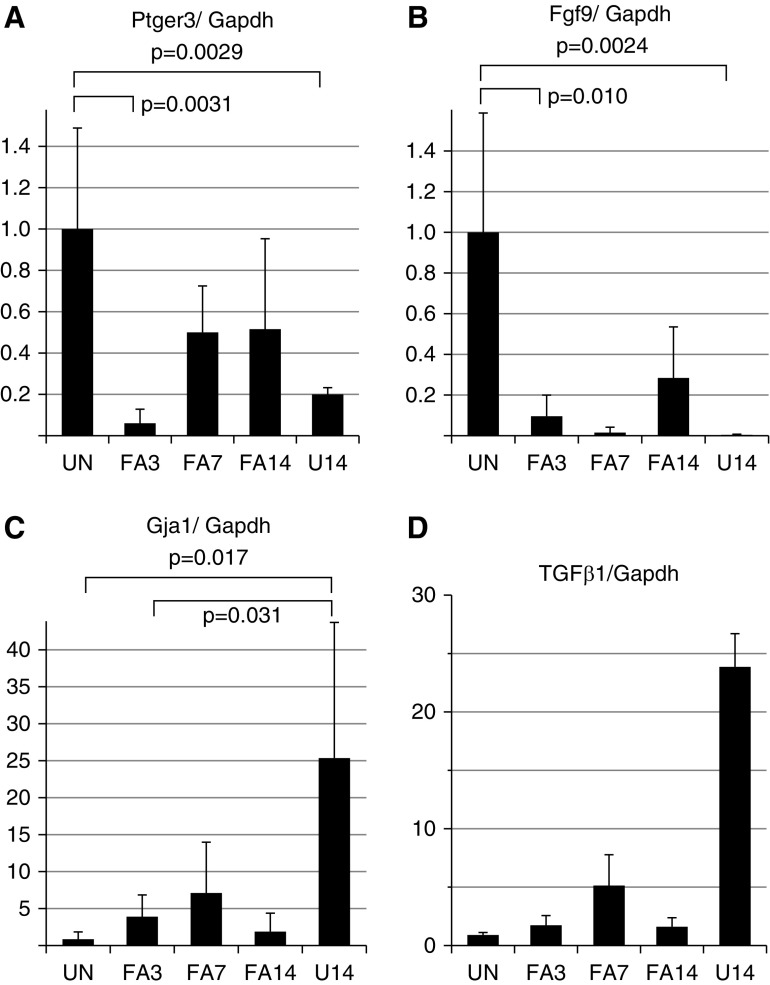
Figure 6.
Quantitative RT-PCR for selected genes confirms expression changes. (A–C) Total RNA samples from PDGFRα-sorted cells were analyzed by quantitative RT-PCR for the indicated genes to confirm Affymetrix array expression differences. Note decline of Ptger3 in the early acute phase (FA3) and its increase during the recovery phase (FA7, FA14). The gap junction protein Gja1, expressed in fibroblasts, shows an expression pattern opposite that of Ptger or Fgf9, with maximum levels in the chronic UUO model (U14). (D) Total RNA was isolated from whole kidneys at the indicated times postinjury and assayed for TGF-β1 by quantitative RT-PCR. The y axis is relative RNA levels in arbitrary units.

