Figure 8.
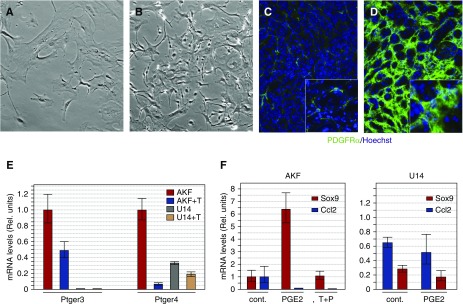
Activated fibroblasts from fibrotic kidneys exhibit alterations in PGE2 responses. Fibroblast from control adult kidneys (AKF) or from fibrotic kidneys were isolated by FACS and cultured as primary cell lines. Morphologies of PDGRa+ fibroblasts in primary cultures from (A) control AKFs or (B) U14 fibroblasts show higher densities of cells with less cytoplasm and more lamellipodia in U14 cell cultures. (C) Densities of PDGFRa+ cells from (C) control and (D) FA14 kidney sections are shown. Insets in (C and D) are higher magnifications. (E) Quantitative RT-PCR for PG receptors Ptger3 and Ptger4 in AKFs and U14-isolated fibroblasts cultured with or without TGF-β (T). (F) Sensitivity to PGE2 (1 μM) in control AKFs and U14 fibroblasts as measured by two PGE2-responsive genes, Sox9 and Ccl2. Cont., control media; Rel., relative; T+P, TGF-β and PGE2.

