Figure 2.
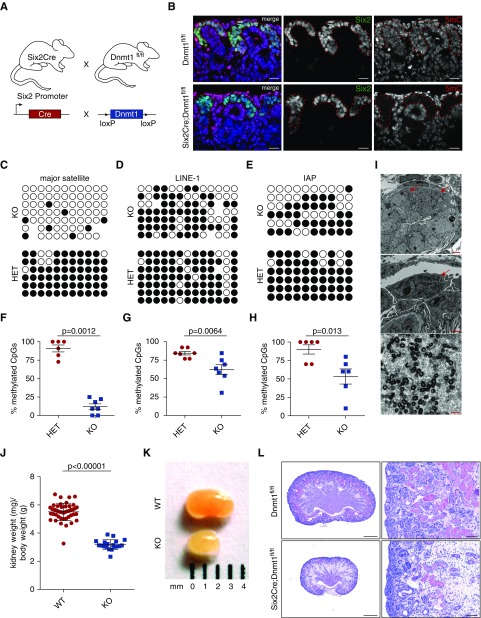
Deletion of Dnmt1, but not Dnmt3a or Dnmt3b, in nephron progenitor cells results in reduced kidney mass. (A) Six2Cre mice were bred with Dnmt1 floxed mice. (B) anti-5-methylcytosine (5mC) colocalizes with Six2 in WT cells but is absent in Dnmt1 KO cells. Scale bar, 50 µm. (C–E) Bisulfite sequencing of major satellite regions, LINE-1 elements, and intracisternal A particles (IAPs). (F–H) quantification of methylation levels of major satellite regions, LINE-1, and IAP elements. Statistical significance was evaluated using Mann–Whitney U test. (I) Production of retrotransposon particles can be seen in electron microscopy. Scale bars: top, 2.5 µm; middle, 1 µm; bottom, 250 nm. Arrows, particle-producing cells. (J) Kidney-to–body weight ratio is reduced in Dnmt1 cKO mice at E19.5 (WT: n=45 and KO: n=19). (K) Macroscopic images of E19.5 WT and Dnmt1 KO kidneys. (L) PAS staining of E19.5 kidney sections shows increased stroma and lack of epithelial structures in Dnmt1 cKO. Scale bars: left, 500 µm; right, 50 µm. HET, heterozygous; KO, knockout; WT, wildtype.

