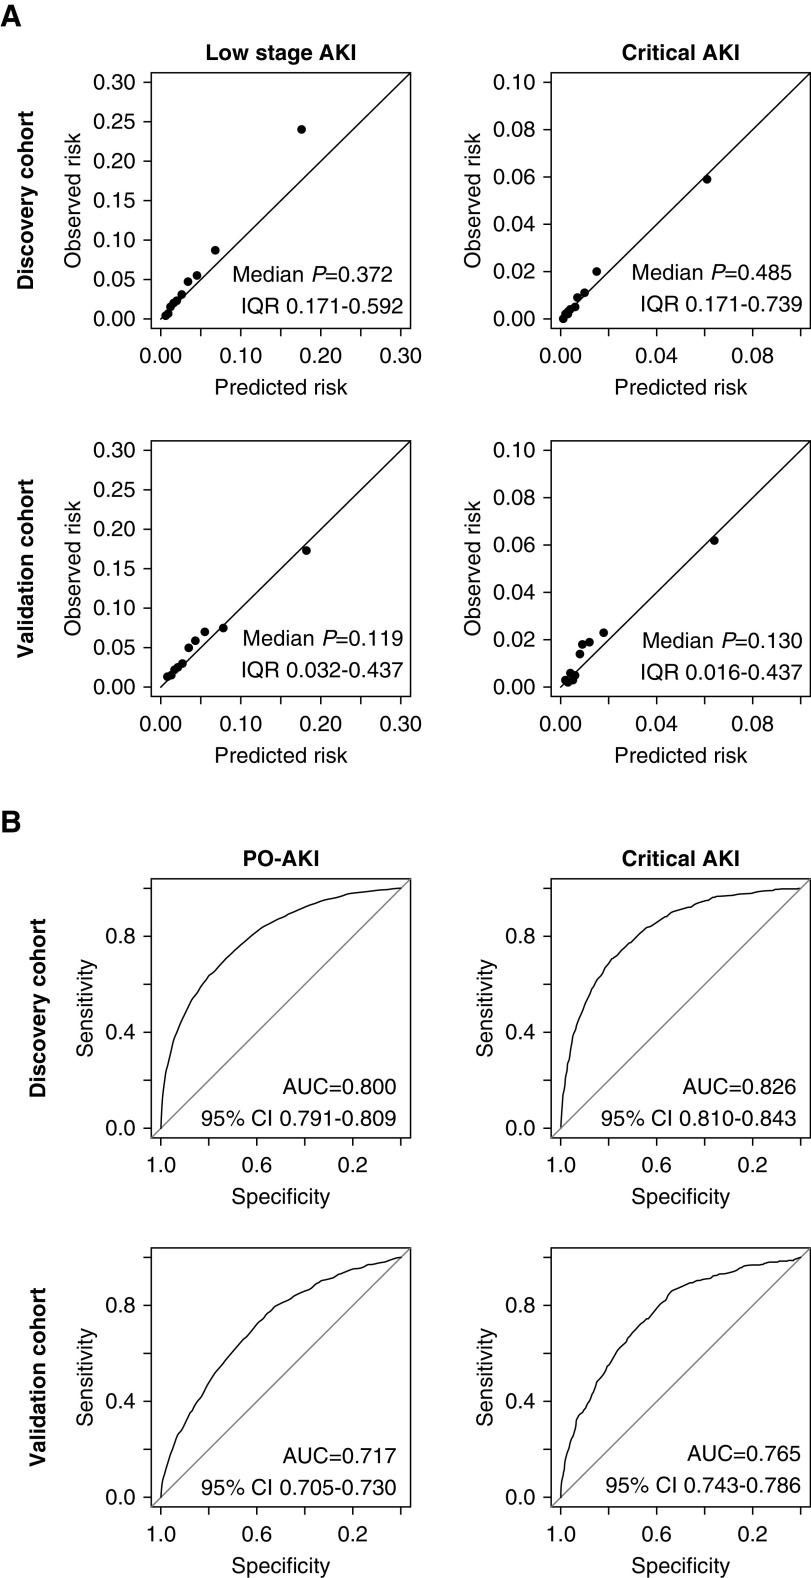
Figure 2.
Calibration plots and receiver operating characteristics curves showed that the calibration and discrimination of the proportional odds model and the SPARK index were in acceptable range. (A) The calibration plots of the constructed proportional odds regression model for the ordinal outcome with finally selected variables. The P values were calculated by the Hosmer–Lemeshow test to assess the goodness of fit, and values <0.05 indicate significantly poor fit. Considering the size of the studied groups, the median P values and IQRs were presented from the test results in 1000 random subsamples with fixed size (n=1000) from the according cohort. (B) The receiver operating characteristics curves showing the predictability of the SPARK indexes for PO-AKI and critical AKI events. AUC values (95% CIs) are presented in each graph.

