Figure 5.
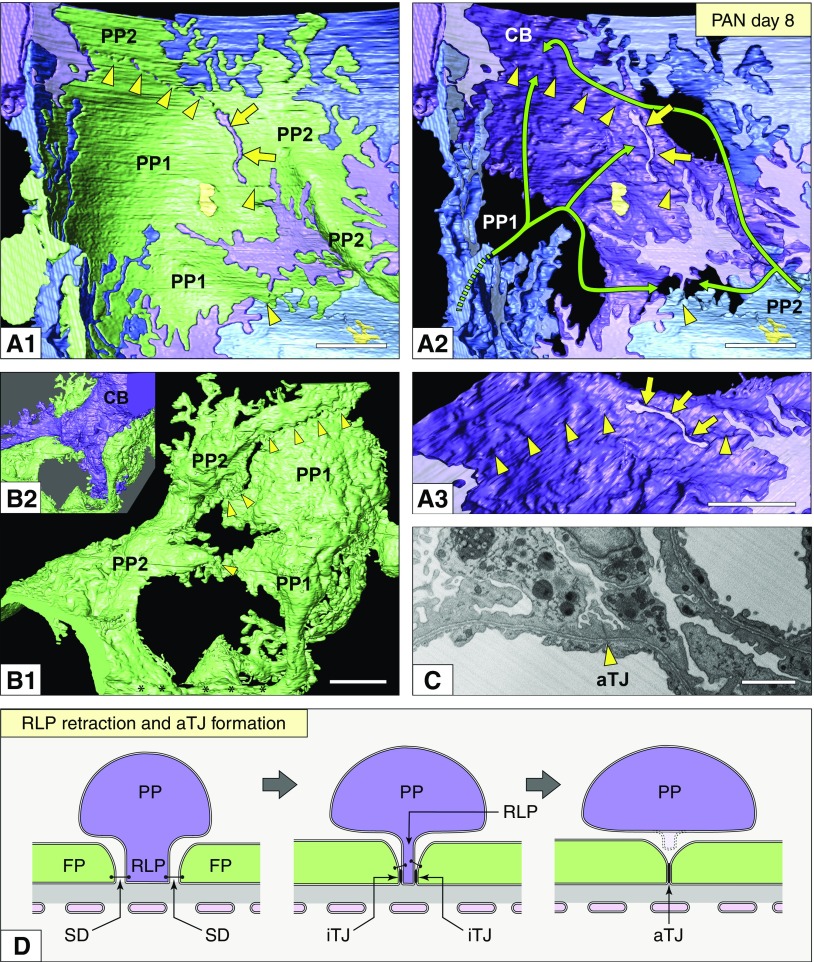
Podocytes formed aTJs in association with foot process effacement. (A1–A3) Basal view. (A1) The aTJs existed between two deformed primary processes of the green podocyte (PP1 and PP2) (arrowheads in A1)—these aTJs were presumably formed by the RLP retraction in the purple podocyte. Arrows indicate remaining RLPs. (A2) The green podocyte was removed from (A1), and its position is indicated by the green lines. Yellow arrows, the remaining RLP; arrowheads, the sites of aTJs between deformed primary processes of the green podocyte. It was not determined whether the three blue regions belonged to the same podocyte or not. (A3) Magnification of the remaining RLP shown in (A2) (arrows). (B1 and B2) Luminal view of the same green podocyte shown in (A1). Arrowheads indicate the aTJs between PP1 and PP2 (B1). The cell body of the purple podocyte (CB) was positioned above the aTJ of the green podocyte (B2). (C) FIB/SEM image showing an aTJ of the green podocyte (arrows). (D) Schematic diagrams showing aTJ formation associated with RLP retraction. Scale bars, 1 μm. FP, foot process; iTJ, intercellular tight junction; PP, primary process; SD, slit diaphragm.

