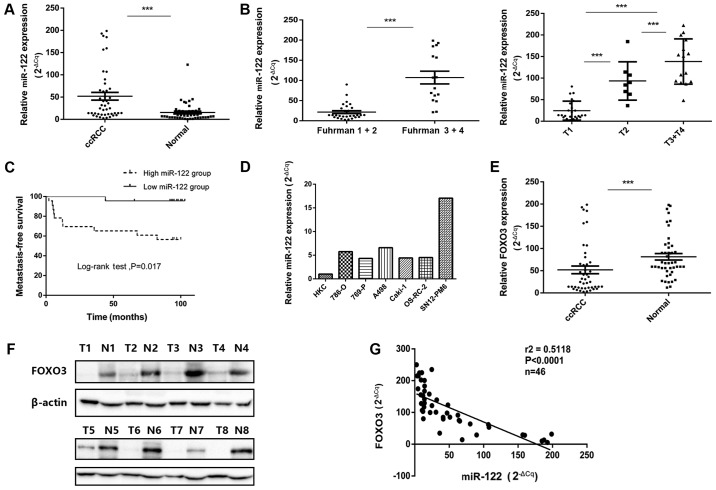
Figure 2.
miR-122 expression levels in ccRCC tissues and cell lines as well as correlation with FOXO3 expression. (A) Increased miR-122 expression levels in ccRCC tissues, compared with adjacent normal tissues. (B) Association between miR-122 expression levels and Fuhrman grades and T stage of ccRCC. (C) Kaplan-Meier analysis of metastasis-free survival time in patients with ccRCC with high (n=23) and low (n=23) miR-122 levels at initial diagnosis (P<0.01; log-rank test). The median of the dataset served as the cutoff point. (D) miR-122 expression levels in various ccRCC cell lines, compared with HKC cells. (E) FOXO3 mRNA levels in ccRCC tissues, compared with normal adjacent tissues. (F) Protein levels of FOXO3 in clinical samples. (G) The negative correlation between FOXO3 mRNA levels and miR-122 levels (n=46, r2=0.5118, P<0.0001). Data are presented as the mean ± standard deviation (***P<0.001). miRNA, microRNA; ccRCC, clear cell renal cell carcinoma; FOXO3, Forkhead Box O3; T, tumor sample; N, normal sample.

