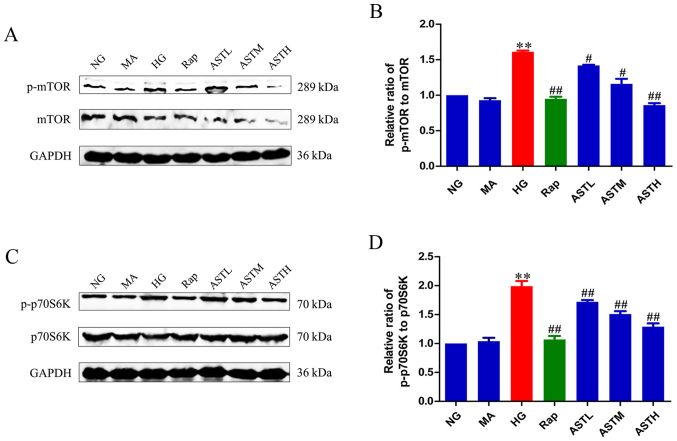
Figure 3.
Effects of AST on mTORC1/p70S6K signaling in HK-2 cells. (A) Western blot analysis of p-mTOR. (B) Densitometry analysis of p-mTOR. (C) Western blot analysis of p-p70S6K. (D) Densitometry analysis of p-p70S6K. Data are expressed as mean ± standard error. n=3. **P<0.01 vs. NG group; #P<0.05 vs. HG group; ##P<0.01 vs. HG group. AST, astragaloside IV; NG, normal glucose 5.56 mmol/l; MA, normal glucose 5.56 mmol/l + mannitol 54.44 mmol/l; HG, high glucose 60 mmol/l; Rap, high glucose + 20 nmol/l rapamycin; ASTL, high glucose + 50 µg/ml AST; ASTM, high glucose + 100 µg/ml AST; ASTH, high glucose + 200 µg/ml AST; p- phospho-; mTOR, mammalian target of rapamycin; p70S6K, ribosomal protein S6 kinase β-1.

