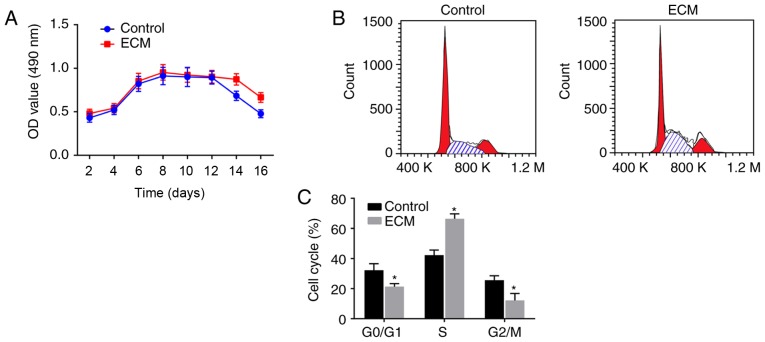
Figure 3.
Fibroblast proliferation is enhanced following adipose ECM induction. (A) MTT assay was used to detect the numbers of viable cells at different days post-induction. (B) Representative plots and (C) quantification of cell cycle distribution analysis of induced fibroblasts. *P<0.05, vs. the Control group (n=3 repeats). ECM, extracellular matrix; OD, optical density; d, day.

