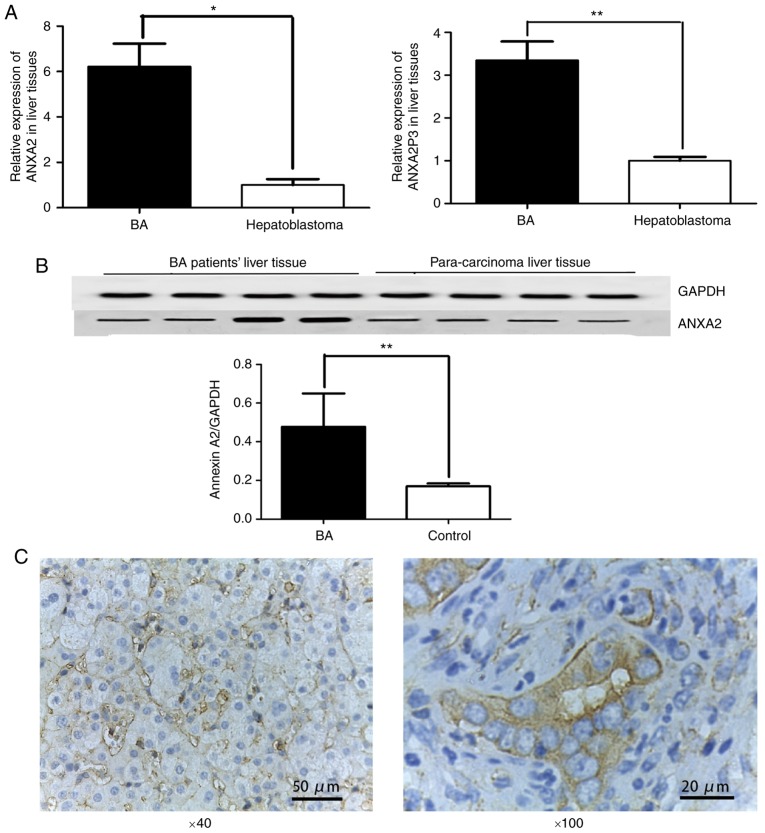
Figure 1.
ANXA2 and ANXA2P3 expression was detected in liver tissues from patients with BA. (A) Liver tissue from patients with BA (n=20) exhibited significantly higher ANXA2 and ANXA2P3 expression compared with in liver tissue from patients with hepatoblastoma (n=6). *P<0.05, **P<0.01. (B) Western blot analysis indicated that ANXA2 protein expression was increased in liver tissue from patients with BA compared with in liver tissue from patients with hepatoblastoma (n=4). **P<0.01. (C) Immunohistochemical staining revealed that ANXA2 protein was expressed in liver tissue from patients with BA. Data are presented as the means ± standard deviation. P-values were obtained by Student’s t-test. ANXA2, Annexin A2; ANXA2P3, ANXA2 pseudogene 3; BA, biliary atresia.

