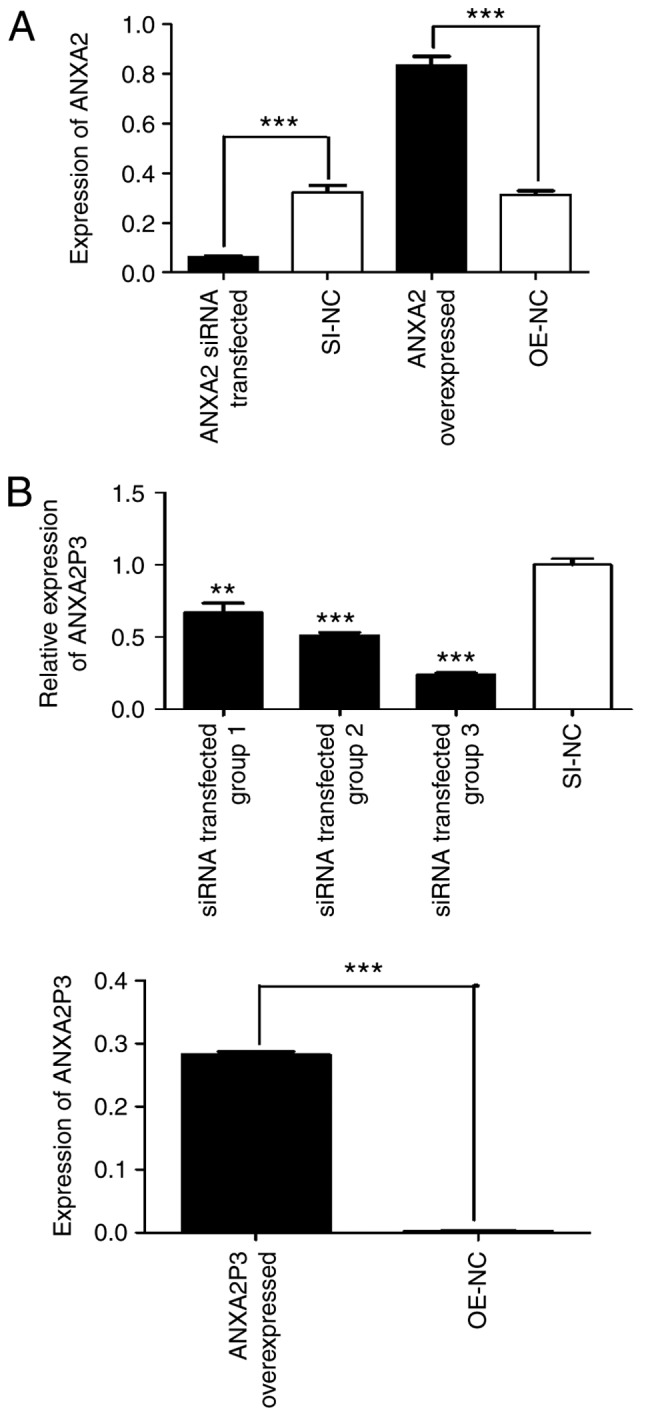
Figure 3.

ANXA2 and ANXA2P3 expression was detected using reverse transcription-quantitative polymerase chain reaction. (A) Expression levels of ANXA2 and (B) ANXA2P3 in siRNA- and pcDNA3.1 plasmid vector-transfected liver cells. Data are presented as the means ± standard deviation. P-values were obtained by Student’s t-test. For all experiments, n=3. **P<0.01, ***P<0.001. ANXA2, Annexin A2; ANXA2P3, ANXA2 pseudogene 3; NC, negative control; OE, overexpression; SI/siRNA, small interfering RNA.
