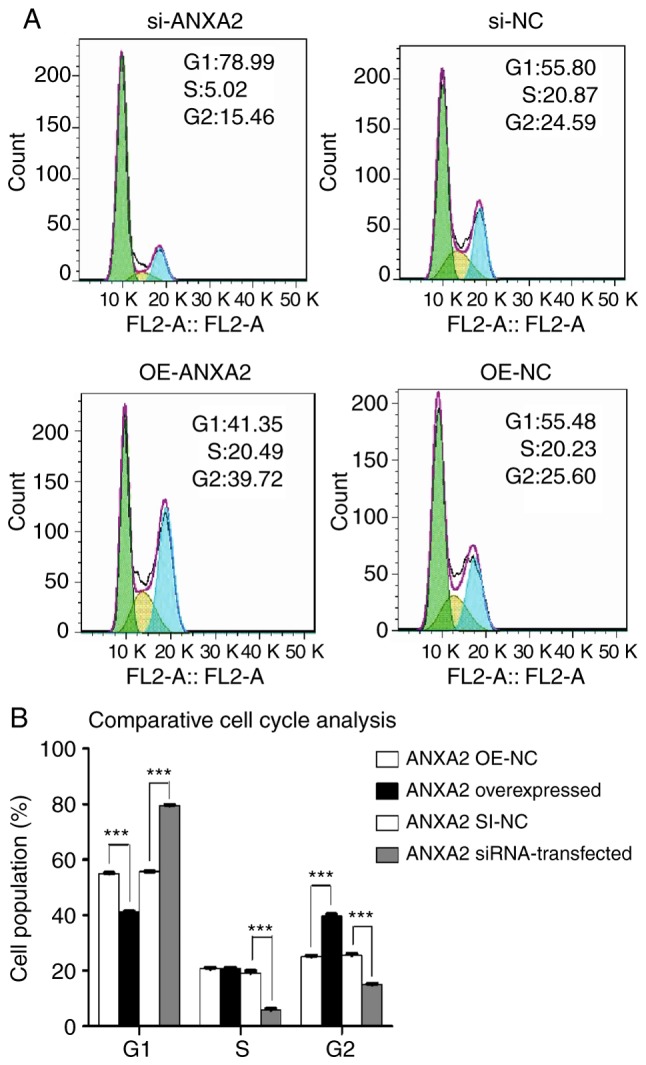
Figure 6.

Results of flow cytometric analysis of cell cycle progression. (A) Of the si-ANXA2-transfected human liver cells, 78.99% were in G1 phase, 5.02% were in S phase and 15.46% were in G2 phase. In the si-NC group, 55.80, 20.87 and 24.59% cells were in G1, S and G2 phases, respectively. In the OE-ANXA2 group, the percentage of cells in G1 phase, S phase and G2 phase was 41.35, 20.49 and 39.72%, respectively. Conversely, in the OE-NC group, the percentage of cells in G1 phase, S phase and G2 phase was 55.48, 20.23 and 25.6%, respectively. (B) Summary of cell cycle distribution in transfected liver cells. Data are presented as the means ± standard deviation. P-values were obtained by Student’s t-test. For all experiments, n=3. ***P<0.001. ANXA2, Annexin A2; NC, negative control; OE, overexpression; SI/siRNA, small interfering RNA.
