
Figure 7.
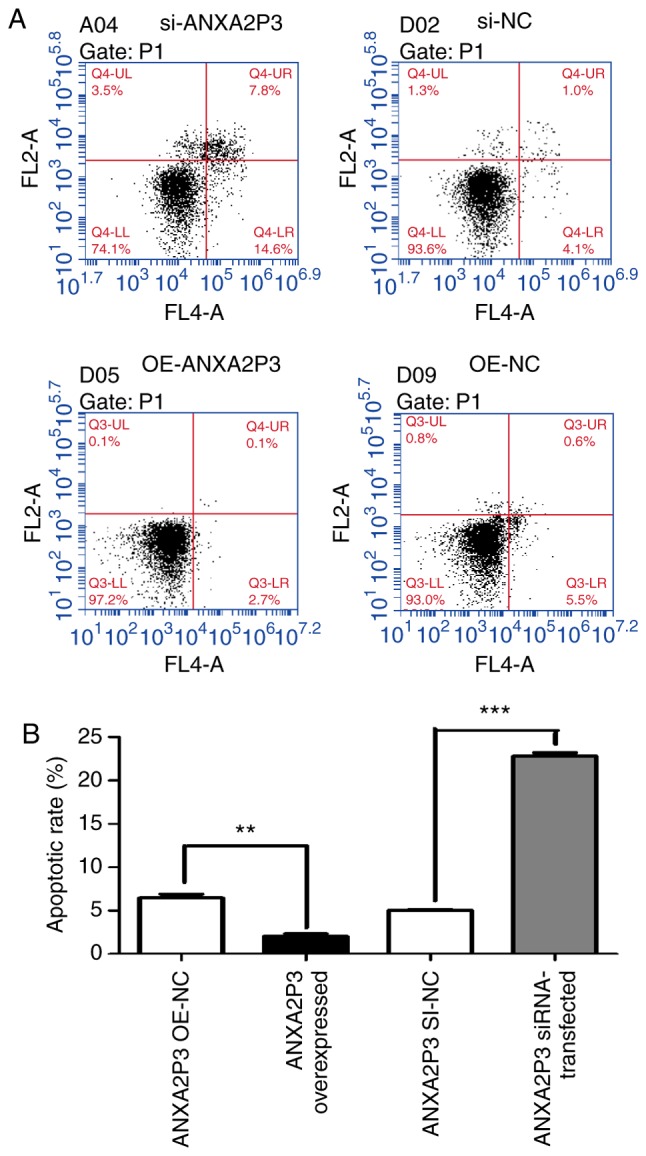
Results of flow cytometric analysis of apoptosis. (A) Apoptotic rate of si-ANXA2P3-transfected liver cells was increased compared with si-NC-transfected liver cells. In the si-ANXA2P3 group, the values were as follows: Normal cells, 74.1%; early apoptotic cells, 14.6%; late apoptotic cells, 7.8%; and necrotic cells, 3.5%. Conversely, in the si-NC group, the values were as follows: Normal cells, 93.6%; early apoptotic cells, 4.1%; late apoptotic cells, 1.0%; and necrotic cells, 1.3%. In the OE-ANXA2P3 group, the values were as follows: Normal cells, 97.2%; early apoptotic cells, 2.7%; late apoptotic cells, 0.1%; and necrotic cells, 0.1%. Conversely, in the OE-NC group, the values were as follows: Normal cells, 93.0%; early apoptotic cells, 5.5%; late apoptotic cells, 0.6%; and necrotic cells and 0.8%. (B) Summary of cell apoptotic rates. Cells in the upper right quadrant are late apoptotic cells and cells in the lower right quadrant are early apoptotic cells. The total apoptotic rate of cells is the sum of the apoptotic rates of the upper right and lower right quadrants. Data are presented as the means ± standard deviation. P-values were obtained by Student’s t-test. For all experiments, n=3. **P<0.01, ***P<0.001. ANXA2P3, Annexin A2 pseudogene 3; NC, negative control; OE, overexpression; si/siRNA, small interfering RNA.