Figure 5.
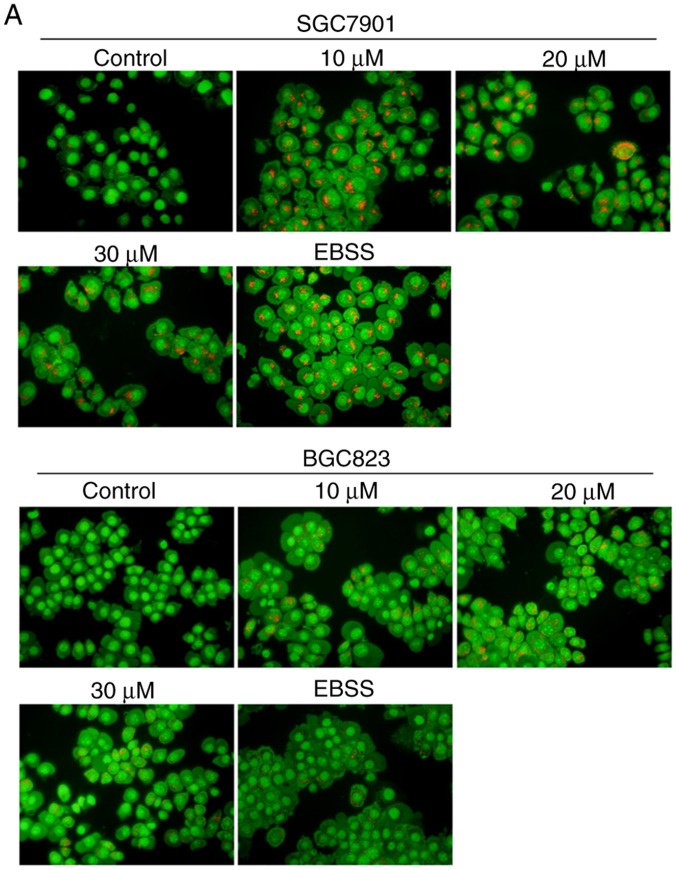
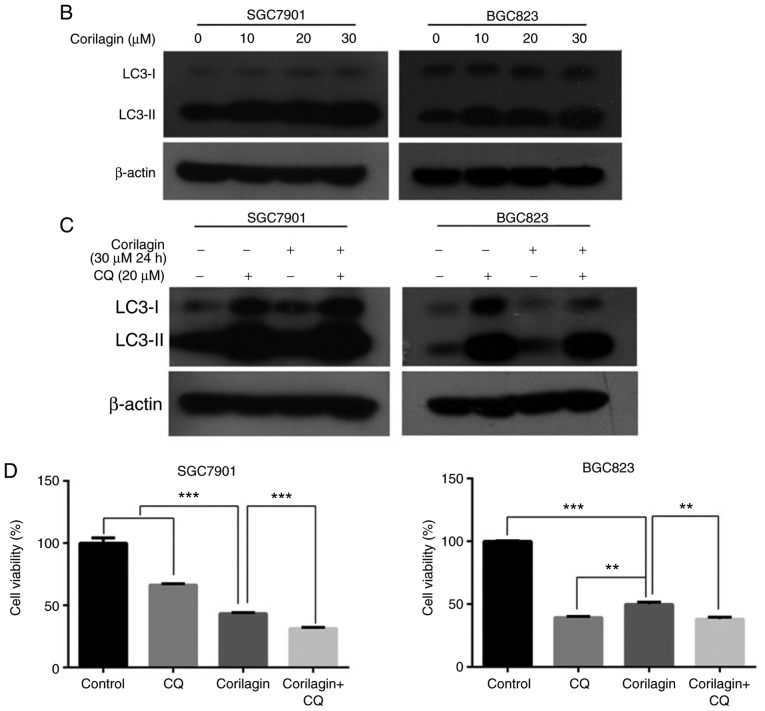
Corilagin triggers autophagy and inhibition of autophagy increases cell growth suppression in SGC7901 and BGC823 cells. (A) Observation of corilagin-induced acidic autophagic vesicles in SGC7901 and BGC823 cells using a fluorescence microscope. SGC7901 and BGC823 cells were treated with corilagin (0, 10, 20 and 30 µM) for 24 h, followed by acridine orange dye (EBSS as positive control), and images were captured under a fluorescence microscope (magnification, ×200). (B) Cells were incubated with corilagin at different concentrations (0, 10, 20 and 30 µM) for 24 h, following which LC3I and LC3II levels were detected via western blot analysis. (C) SGC7901 and BGC823 cells were pretreated with CQ (20 µM) for 2 h, then incubated with corilagin (30 µM) for 24 h, and expression of LC3 was evaluated by western blot analysis. (D) Cells were pretreated with CQ (20 µM) for 2 h, then treated with corilagin (30 µM) for 24 h, and cell viability was measured using a 3-(4,5-dimethylthiazol-2-yl)-2,5-diphenytetrazolium bromide assay. Results are expressed as the mean ± standard deviation (n≥3) from three independent experiments. **P<0.01 and ***P<0.001 vs. control group (detected using Student's t-test). CQ, chloroquine.


