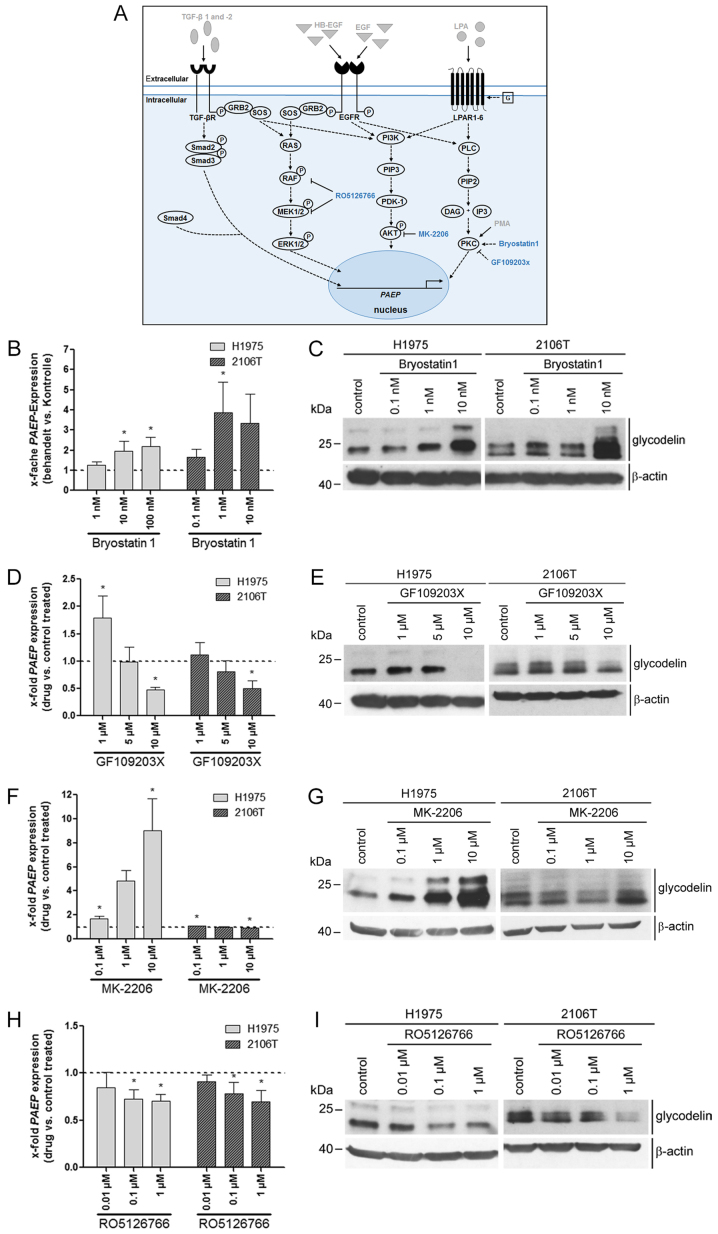
Figure 2.
Downstream signalling pathways including PKC, AKT and RAF/MEK affected PAEP/glycodelin levels in NSCLC cells. (A) Overview of previously investigated pathway inducers (grey with drawn down arrows) and components of signalling pathways that were analysed in the next experiments (blue). Dotted arrows depict assumed or literature data based relationships between signalling pathway regulators. (B-I) Two NSCLC cell lines were serum-starved overnight. The cells were then cultivated with an activator of PKC (Bryostatin) for 1 h, as well as with inhibitors of PKC (GF109203X), AKT (MK-2206) and RAF/MEK (RO5126766) for 24 h. (B, D, F and H) qPCR visualizing PAEP expression was performed from 3 independent experiments. Dotted line at 1 represents the expression in control-treated cells (mean of the Ct-values and mean SD are shown). Statistical significance was defined as *P<0.05 (one-way ANOVA and Dunnett's test; referring to control-treated cells). (C, E, G and I) Western blot analysis detected the glycodelin levels. β-actin was used as a loading control (cropped blots are shown). PAEP, progesterone associated endometrial protein; NSCLC, non-small cell lung cancer; PKC, protein kinase C.

