
Figure 2.
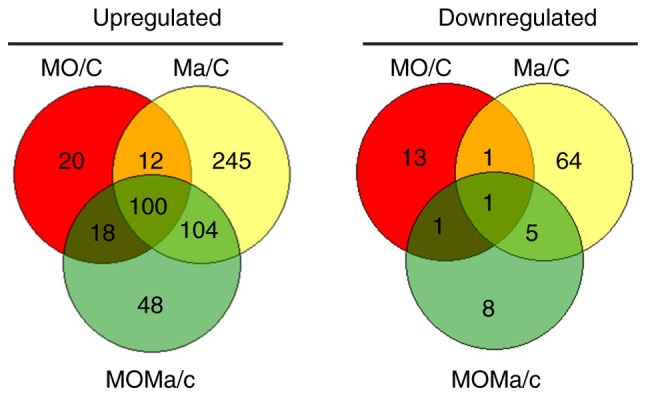
Venn diagram analysis of the genes that were upregulated (left) or downregulated (right) by morphine tolerance and/or melatonin treatment compared with the control group. In each pair test, the upregulated genes were identified as follows: Log2 |Fold change| ≥ 1 and P<0.05 In the diagram, red circles represent genes putatively affected by long-term morphine application, yellow circles represent genes influenced by melatonin treatment and green circles represent genes for which melatonin-induced expression changes were putatively affected by morphine. All genes considered were differentially expressed compared with the untreated group. C, control (saline infusion/vehicle injection/saline challenge); MO, morphine (morphine infusion/vehicle injection/morphine challenge); Ma, melatonin (morphine infusion/melatonin injection/saline challenge); MOMa, (morphine infusion/melatonin injection/morphine challenge).