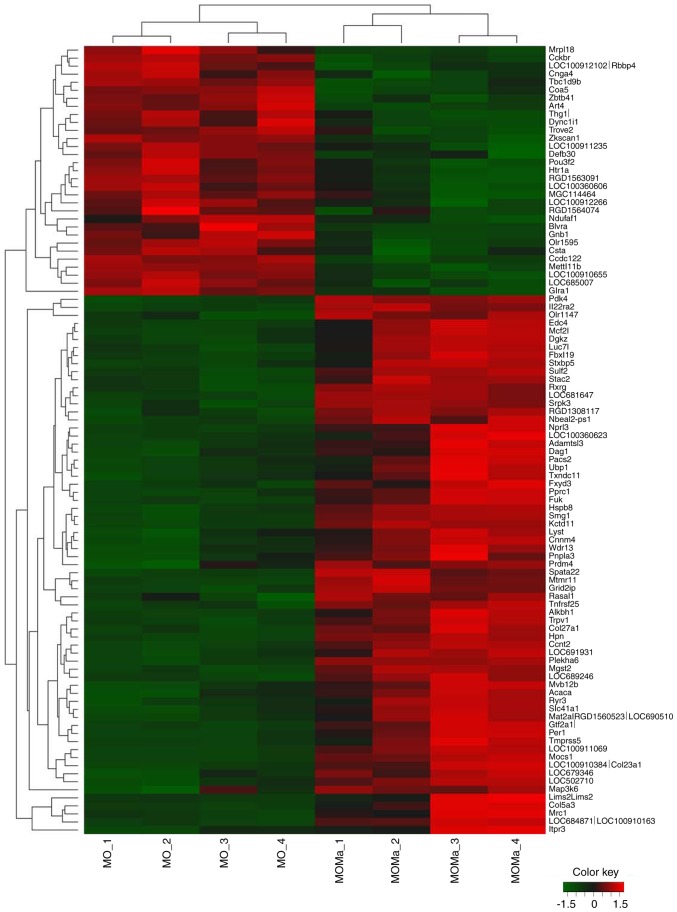
Figure 3.
Hierarchical clustering analysis of genes with expression completely inverted between the MO and MOMa group. Upregulated genes are indicated in red, and downregulated genes are presented in green. The signal intensity values of each sample were transformed to log2 values and subjected to hierarchical clustering using standard correlation. MO, morphine (morphine infusion/vehicle injection/morphine challenge); MOMa, (morphine infusion/melatonin injection/morphine challenge).

