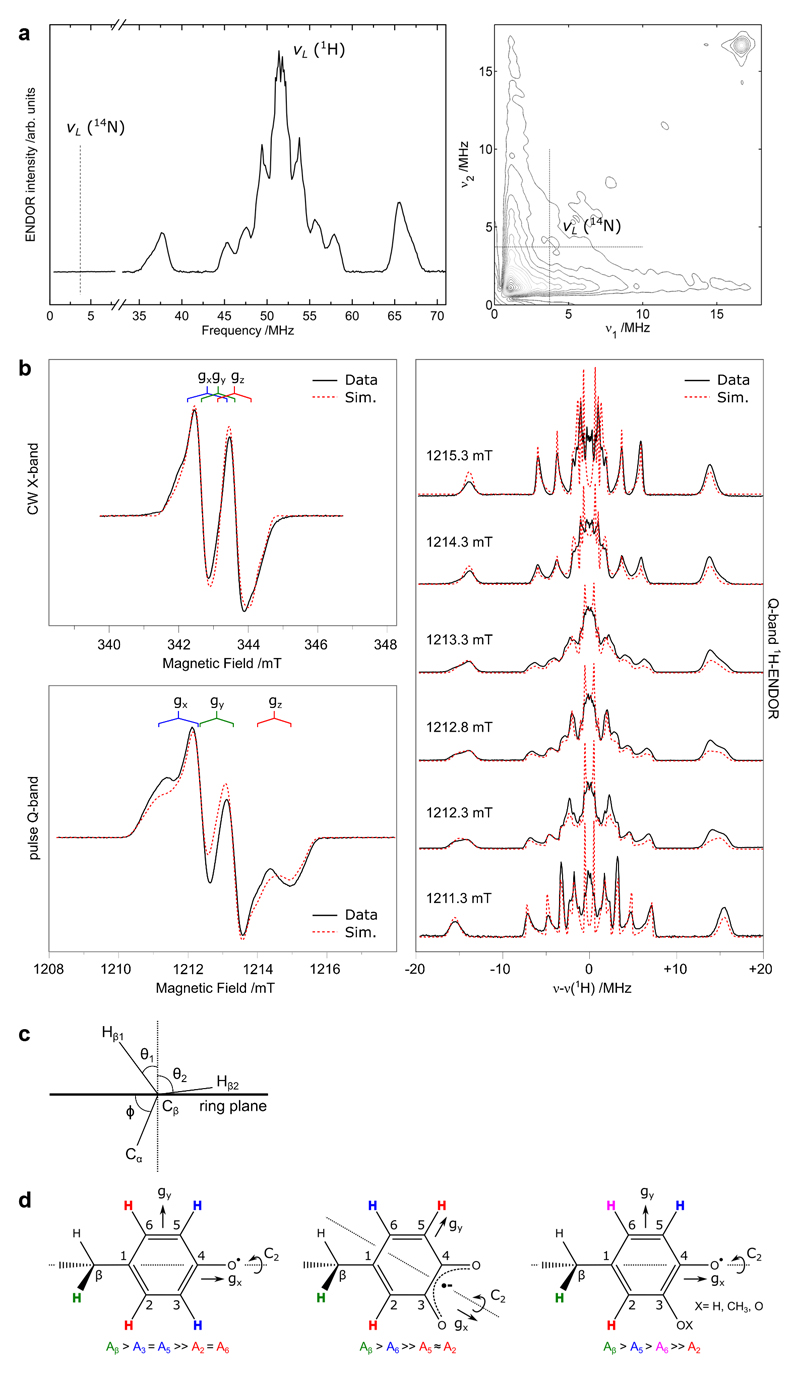
Extended data Figure 7. EPR/ENDOR characterization, see Supplementary information.
a) Q-band ENDOR and HYSCORE spectra of the spectral region where an 14N hyperfine coupling should be observed. Experimental parameters are listed in the materials and methods section.
b) Full multifrequency (X-/Q-band) EPR dataset and corresponding field dependent Q-band ENDOR spectra. Experimental parameters are listed in the materials and methods section. The red dashed lines represent a simultaneous simulation of all datasets using the spin Hamiltonian formalism. Simulation parameters are listed in Supplementary information Table 1.
c) Inferred orientation (θ1, θ2) of the Cβ protons relative to the phenoxyl radical ring plane as determined by the dihedral angle (ϕ) between the ring plane (C1) and Cα.
d) Candidates discussed for the MfR2 radical species, see Supplementary information.
All ENDOR measurements were repeated at a second microwave frequency (W-band) giving similar results. Pulse EPR and ENDOR measurements represent long data accumulations/averages. EPR: 300 averages (6 scans/50 shots). ENDOR: 600 averages (600 scans/1 shot).

