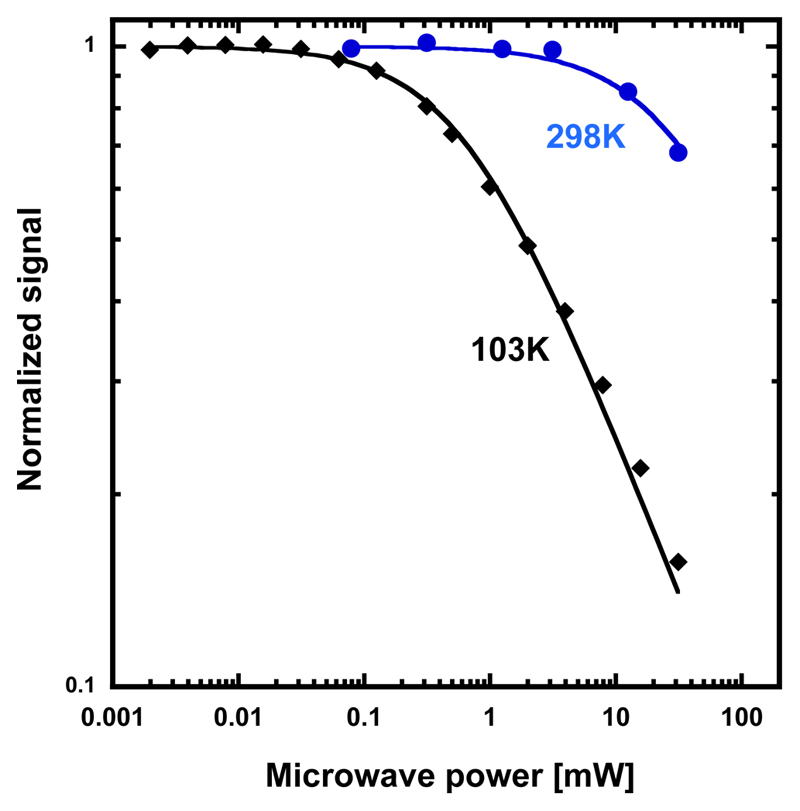
Extended data Figure 8. EPR saturation.
EPR saturation behavior of the MfR2 radical at 103 and 298 K. Saturation curves at different temperatures determine the microwave power at half saturation P1/2. The temperature dependence of P1/2 gives information about possible relaxing transition metals in the vicinity of the radical. A fast relaxing metal site will give a higher P1/2 than for an isolated radical. The microwave saturation behavior of the MfR2 is similar to that for an hv-irradiated tyrosine solution. Here we evaluate P1/2 ≈ 0.6 mW at 103 K and P1/2 ≈ 30 mW at 298 K for MfR2. This can be compared to hν Tyr• with P1/2 ≈ 0.4mW at 93 K and E. coli Tyr• with P1/2 ≈ 150 mW at 106 K and not possible to saturate at 298K.

