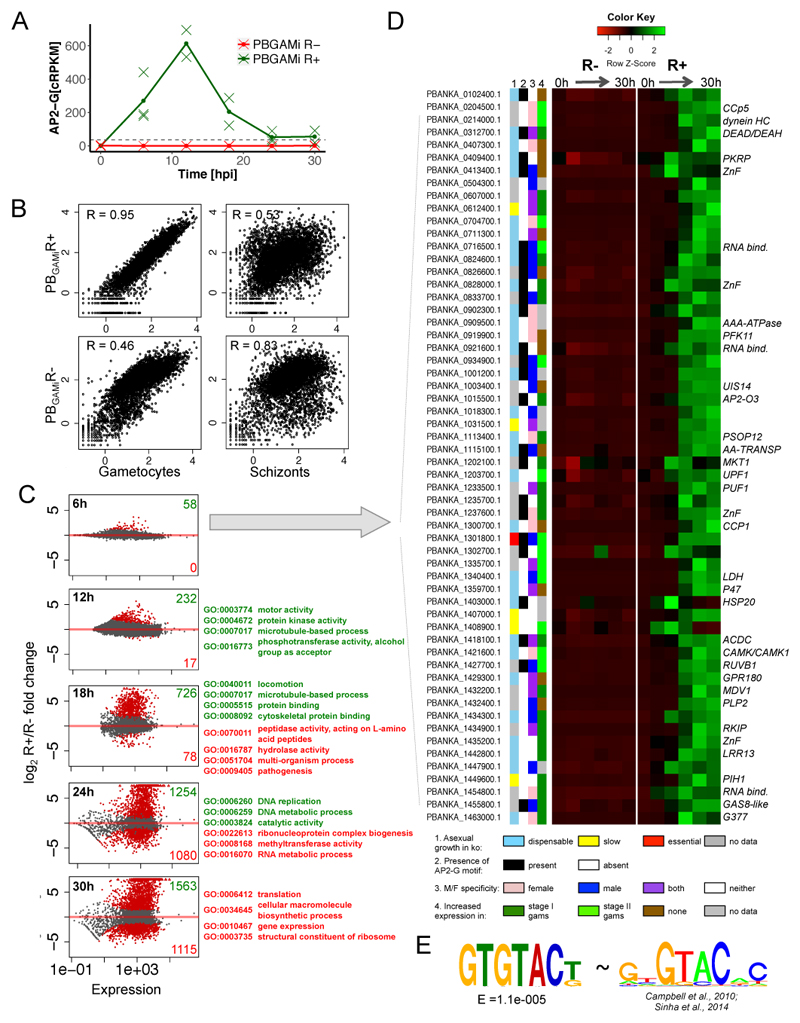
Fig. 3. Transcriptome changes in PBGAMiR- and PBGAMR+ parasites reveal gametocyte-specific transcriptional program.
A. Expression of ap2-g transcript in PBGAMiR- and PBGAMiR+ populations. Corrected rpkm calculated as seen in Supplementary Figure 6. Means and individual data points from 3 (0, 6 and 24h) or 2 (12,18 and 30h) independent biological replicates are shown. Horizontal, black dashed line indicates maximal native ap2-g RNA expression in WT population11.
B. Comparison of transcriptomes (rpkm’s) from PBGAMiR- and PBGAMiR+ populations 30 hpi to purified gametocytes and schizonts transcriptomes. R = Spearman’s rank correlation coefficient. Correlation values representative for n=3 experiments.
C. Differential expression analysis between PBGAMiR- and PBGAMiR+ populations at different time points. Plots show log2 fold change of gene expression vs. expression levels, with differentially expressed genes marked in red. Numbers of genes overexpressed in PBGAMiR- (red) and PBGAMiR+ (green) and example GO terms enriched within each group next to each graph. All samples for transcriptome analysis were generated from three independent time-course experiments.
D. Genes responding early to AP2-G overexpression. Shown are: knock-out growth phenotype in asexual blood stages14, sex specificity of expression in P.berghei15, gametocyte specificity in P.falciparum27, presence of AP2-G motif(s) in 2 kb upstream of the start codon, and gene expression profile through the time course. Available gene symbols are shown on the right of the expression profile.
E. The DNA motif enriched upstream of genes in panel D (left) compared with the known AP2-G binding motif2,16 (right).

