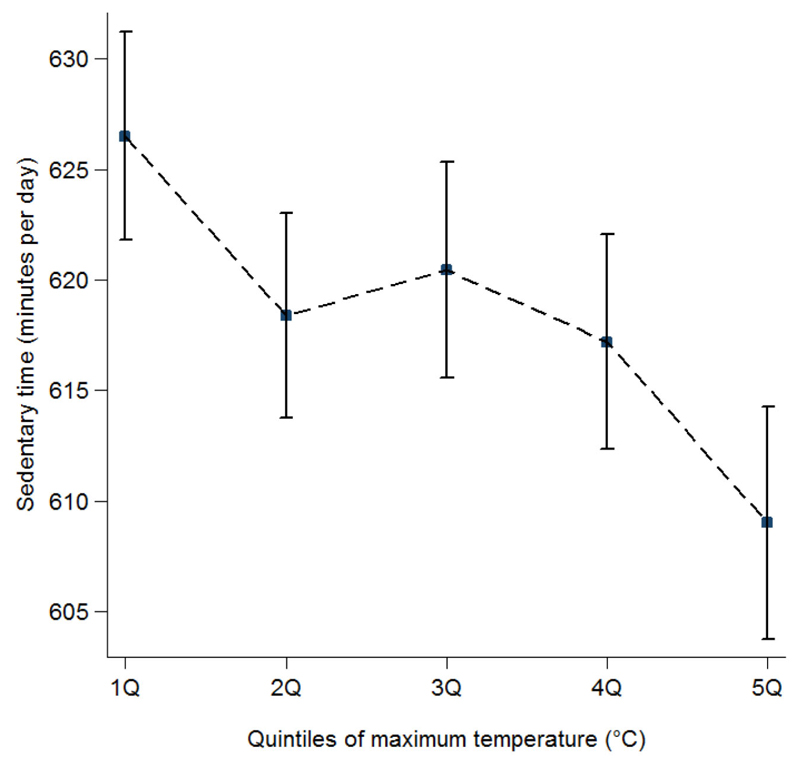
Figure 1.
Raw data (n = 1361). Plots depicting relationship between sedentary time (mean, 95% CI), and quintiles (Q) of maximum temperature. Note. Quintiles of maximum temperature were derived counting every day each participant wore an accelerometer (median, minimum and maximum): 1Q: 6.3 (–3.5, 9.2); 2Q: 11.0 (9.3, 13.0); 3Q: 15.3 (13.1, 16.5); 4Q: 17.9 (16.6, 19.0); 5Q: 20.8 (19.1, 29.5). P-value for the difference between the quintiles was P < .001.

