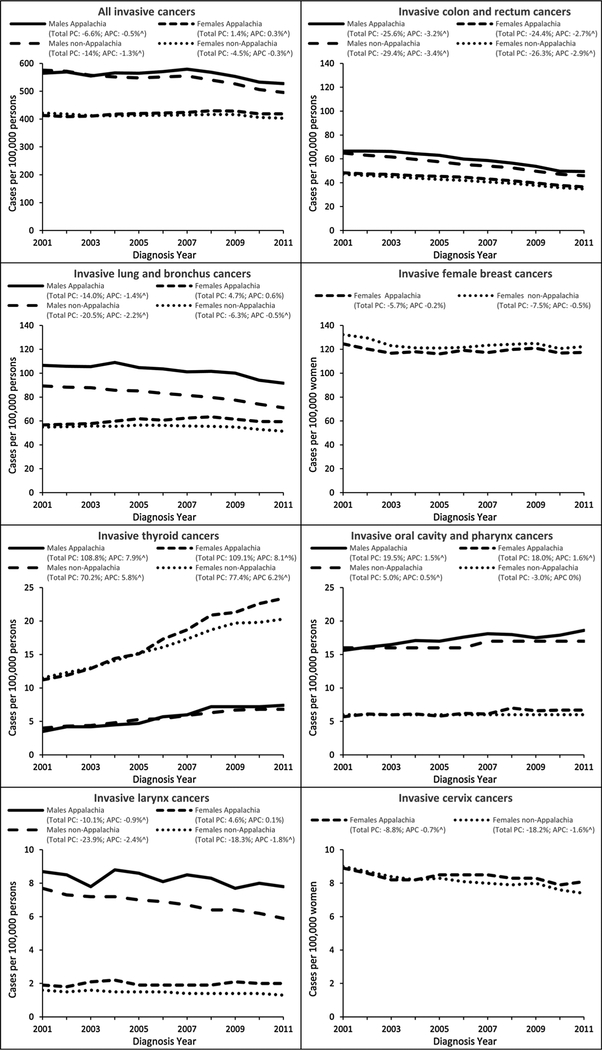
Figure 2.
Temporal trends in invasive cancer IRs by cancer site, sex, and Appalachian status, United States, 2001–2011. Rates are per 100,000 and age-adjusted to the 2000 US standard population. Percent change (PC) was used to quantify the total percent change in rates from 2001 to 2011. Annual percent change (APC) was used to quantify the change in rates during 2001 to 2011 and was calculated using weighted least squares regression. Caret (^) denotes APC is significantly different from zero (P < 0.05). Appalachia includes select counties in Alabama, Georgia, Kentucky, Maryland, Mississippi, New York, North Carolina, Ohio, Pennsylvania, South Carolina, Tennessee, and Virginia, and all counties in West Virginia. Non-Appalachia includes all counties not in Appalachia.

