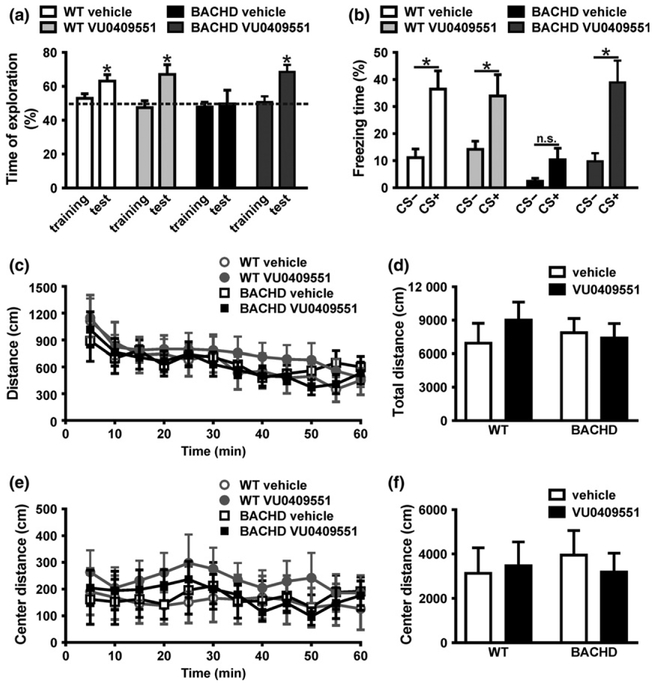
Fig. 1.
VU0409551 treatment improved BACHD memory without altering locomotion. (a) Graph shows time of object exploration by wild-type (WT) and BACHD mice, calculated as the recognition index for the training and test phases. A score of 50% indicates no preference. Data represent the means ± SEM, n = 7–9. * indicates significant difference from chance exploration (50%) (p < 0.05). (b) Graph shows the freezing response of WT and BACHD mice in the presence (+) or absence (−) of conditioning stimulus (CS). Data represent the means ± SEM, expressed as percentage of freezing time during CS+ and CS−, n = 7–9. * indicates significant difference comparing CS+ and CS− (p < 0.05) and ‘n.s.’ indicates no difference comparing CS+ and CS−. Graphs show the distance travelled by WT and BACHD mice every 5 min (c), as well as the total distance travelled over 60 min (d) in the open field apparatus. Graphs also show the distance travelled by WT and BACHD mice every 5 min (e), as well as the total distance travelled over 60 min (f) in the center of the open field apparatus. Data represent the means ± SEM. Number of mice: WT-vehicle n = 7, WT-VU0409551 n = 8, BACHD-vehicle n = 8, and BACHD-VU0409551 n = 9.

