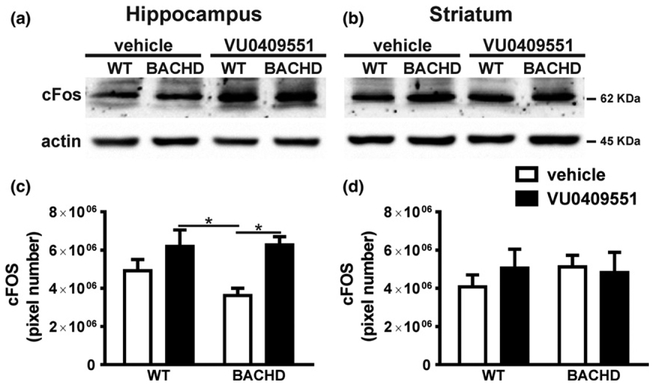
Fig. 3.
VU0409551 treatment enhanced c-Fos expression in BACHD mice. Shown are representative immunoblots for c-Fos (upper panel) and actin (lower panel) expression in the hippocampus (a) and striatum (b) of wild-type (WT) and BACHD mice, treated with either vehicle or VU0409551. 80 μg of total cell lysate was used for each sample. Graphs show the densitometric analysis of c-Fos expression in the hippocampus (a) and striatum (b) of WT and BACHD mice, treated with either vehicle or VU0409551. Data represent the means ± SEM. Number of mice: WT-vehicle n = 6, WT-VU0409551 n = 5, BACHD-vehicle n = 6, and BACHD-VU0409551 n = 5. *indicates significant difference (p < 0.05).

