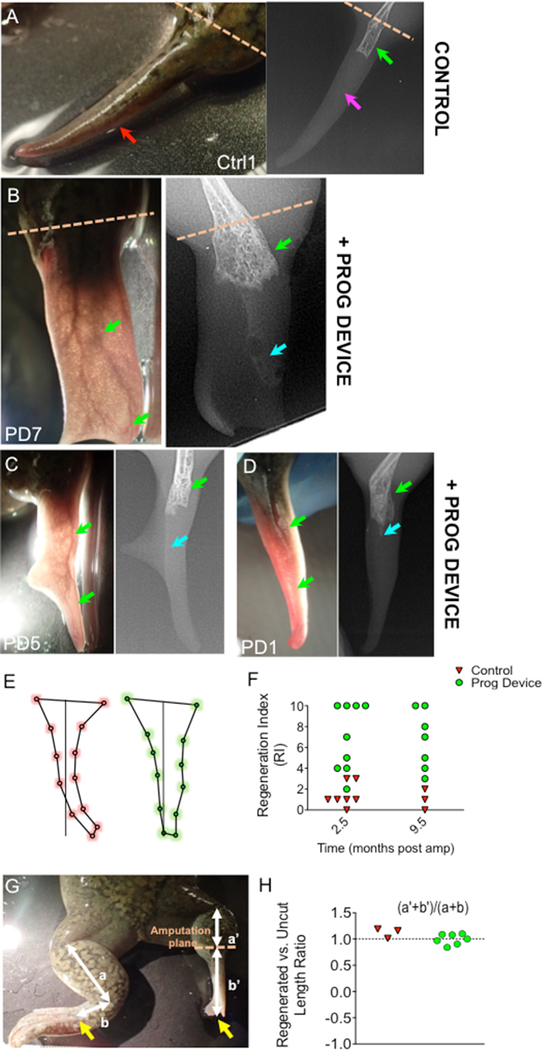
Figure 3. Instead of the Typical Spikes Formed in the Absence of Treatment, Combined Prog-Device Treated Animals Regenerate Complex Patterned Paddle-like Structures.
(A–D) Anatomical outcome (left) and X-ray images (right) of regenerates formed in adult Xenopus hindlimb amputation after no treatment (Ctrl, A) and after 24-hr combined treatment of drug-loaded device (Prog-device, B–D).
(A) Red arrow indicates the hypomorphic cartilaginous structure, spike, lacking specialized tissues.
(B–D) Green arrows on soft tissue images (left panels) indicate the dense and sprouted vascularization, easily visualized due to unpigmented epithelium covering the regenerates of treated PD7 (B), PD5 (C), and PD1 (D) animals. X-ray images (right panels) show the new bone growth within the regenerates of treated PD7 (B), PD5 (C), and PD1 (D) animals (weakly ossified bone close to the amputation plane, green arrows; non-ossified bone or regenerated cartilage traveling toward the distal part, turquoise arrows in B–D; magenta arrow in A indicates the absence of bone regeneration in the distal spike). Individual identification of each animal is indicated in white (Ctrl: untreated control, PD: Prog-device treated, followed by the individual number).
(E) Shape profiles, as obtained after MorphoJ software measurements (see Figure S2B for details), for un-treated (red) and Prog-device treated animals (green). Each circle indicates the average position for each landmark, after computations for n = 3 and n = 7 animals in Ctrl and Prog-device groups, respectively. Quantification and statistical analysis of these shape states showed significant differences in the Mahalanobis distance (p < 0.05) for the profile of the shape of the regenerate.
(F) Application of RI to regenerates at both 2.5 and 9.5 mpa (two-way ANOVA, p < 0.01 for ‘‘group’’ factor). Scatterplots are presented in which each dot represents one animal.
(G and H) Quantification of regenerated limb length (a′ + b′) relative to uncut limbs (a + b) revealed that the regenerating hindlimb stops growing at a point at which, under normal growth conditions, the animal’s digits appear (yellow arrows) (G). Values in (H) are represented with scatterplot, in which each dot represents one animal.
See also Tables S1 and S2.

