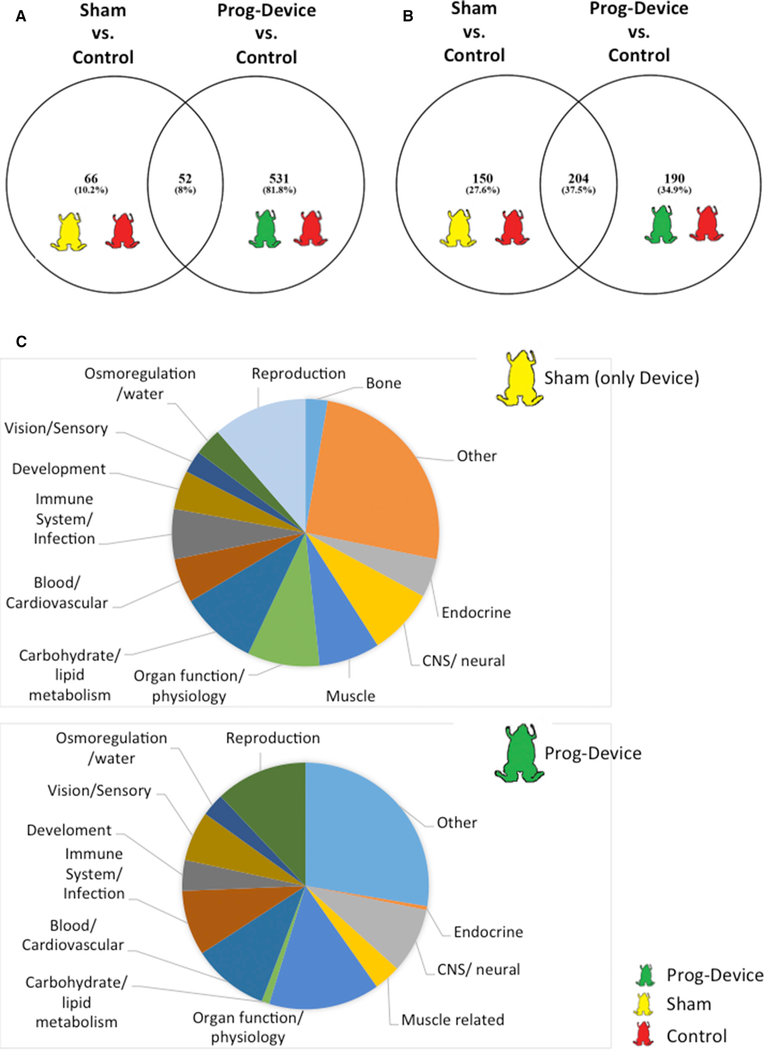
Figure 6. Subnetwork Enrichment Analysis of All Three (Ctrl, Sham, and Prog-Device) Blastema Datasets Showing Quantitatively and Qualitatively Differences for Regulated Transcripts and Cell Processes after Combined Prog-Device Treatment.
(A and B) Venn diagram comparing genes (A) and subnetworks (B) regulated in blastema for both Sham and Prog-device interventions.
(C) Pie chart of the functional classification of the pathways exclusively regulated after Sham intervention (top, amputation followed by only hydrogel device) or after the combined Prog-device treatment (bottom, amputation followed by hydrogel device + drug).
Complete data are presented in Data S1.

