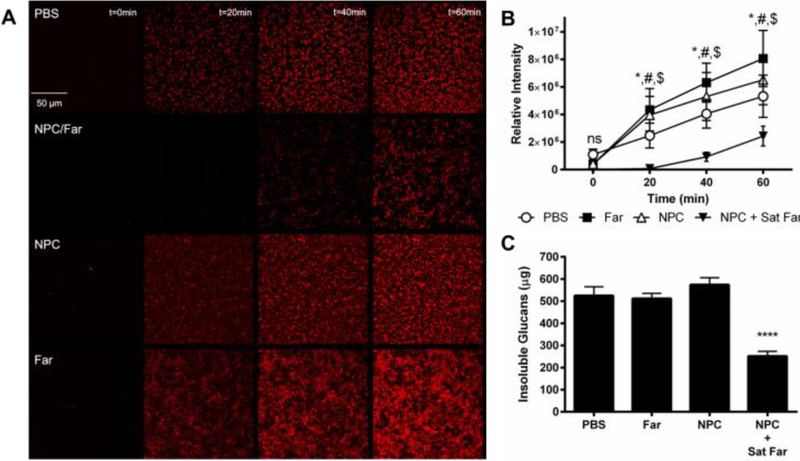
Figure 6. Saturated farnesol-loaded NPC formulation improved biofilm inhibition due to reduced total biomass caused by prevention of insoluble glucan formation.
A) Fluorescence microscopy images showing glucan formation by GtfB using Alexa 647 sucrose over 60 minutes for PBS (control), saturated farnesol-loaded NPC, NPC alone, and farnesol alone treatments. B) Quantification of relative intensity of glucans formed in (A) using ImageJ. Data shown as average and standard deviation from n=4 independent experiments. * p ≤ 0.05 PBS versus NPC + Sat Far, # p ≤ 0.0001 Far versus NPC + Sat Far, $ p ≤ 0.001 NPC versus NPC + Sat Far, ns = no significant difference from Two-way ANOVA with Tukey’s multiple comparisons test. C) GtfB activity for PBS, farnesol alone, NPC alone, and saturated farnesol-loaded NPC groups using a colormetric assay for insoluble glucans. Data shown as average and standard deviation from n=3 independent experiments. **** p < 0.0001 from One-way ANOVA with Dunnett’s multiple comparisons test. Abbreviations: Far, farnesol; NPC, nanoparticle carrier; Sat, saturated farnesol formulation.

