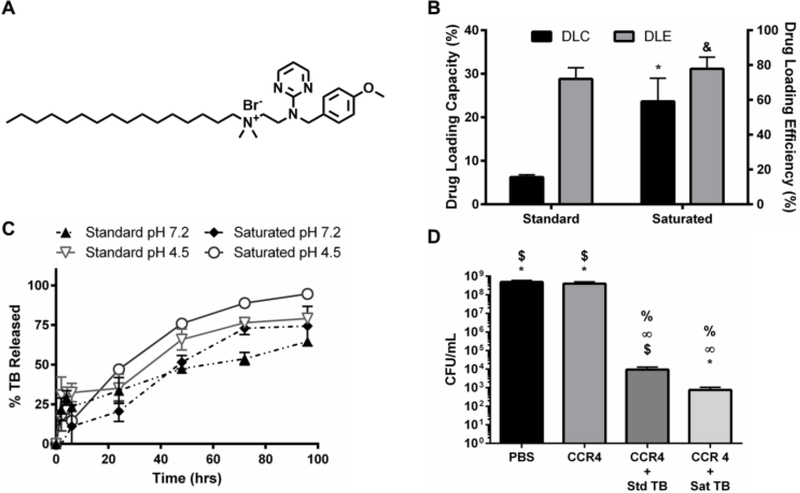
Figure 8. Saturated thonzonium bromide-loaded NPC formulation also improved drug loading capacity, lengthened release times, and improved anti-biofilm efficacy.
A) Chemical structure of thonzonium bromide. B) Drug loading capacity (left axis) and drug loading efficiency (right axis) graphs for CCR 4 NPCs comparing standard TB loading to saturated TB loading approach. & = no significant difference, *p ≤ 0.05, versus standard loading from unpaired Student t-test with Welch’s correction. Data shown as average and standard deviation using representative images from n=2–4 independent experiments. C) TB release kinetics for standard and saturated loading formulations using CCR 4 NPCs. D) CFU/mL values obtained for biofilms for each TB treatment group tested at pH 5 and pH 7. % p ≤ 0.01 versus PBS, 221E p ≤ 0.01 versus CCR 4, * p ≤ 0.05 versus CCR 4 + Std TB, $ p ≤ 0.01 versus CCR4 + Sat TB from unpaired Student t-test with Welch’s correction. Data shown as average and standard deviation from n=4 independent experiments. Abbreviations: CCR, corona-to-core molecular weight ratio; NPC, nanoparticle carrier; Sat, saturated formulation; Std, standard formulation; TB, thonzonium bromide.

