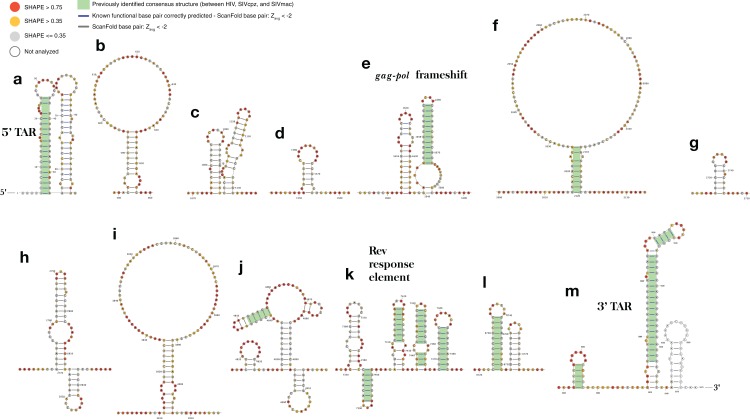
Figure 5. ScanFold-Fold identified base pairs in the HIV-1 genome.
All base pairs shown were predicted to have a Zavg < −2, using ScanFold-Scan with a 120 nt window length, one nt step size, and mononucleotide shuffling 50 times. All nucleotides are depicted with their SHAPE reactivity scores from Watts et al. (2009) (annotated using VARNA; Darty, Denise & Ponty, 2009 with the colors mapped on a gradient to depict a reactivity ≤0.35 as gray, a reactivity >0.75 as red and a reactivity between 0.35 and 0.75 as yellow). All base pairs which have been highlighted with a green box were identified as conserved “consensus structures” in a comparative analysis between HIV-1 and two lentiviral relatives, SIVcpz and SIVmac (Lavender, Gorelick & Weeks, 2015). All structures are labeled from (A) to (M) based on their genomic position from 5′ to 3′, with all known functional structures labeled with their names.

