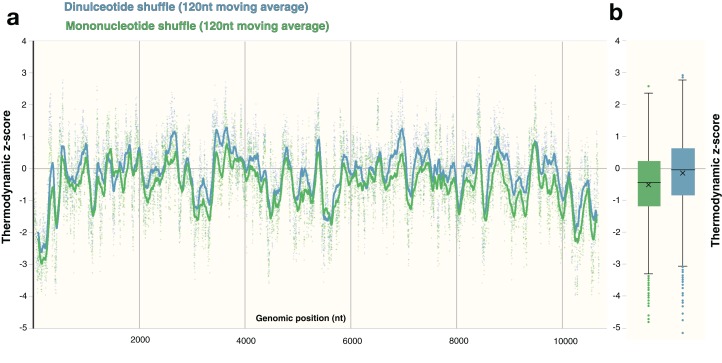
Figure 6. Comparison of shuffling techniques.
The ZIKV genome was analyzed with ScanFold-Scan using a 120 nt window size, one nt step size, and 50 iterations of either mononucleotide or dinucleotide shuffling during the calculation of the thermodynamic z-score. (A) For each window, the calculated z-score is plotted as a point along the genome (positioned according to the starting coordinate of the respective window). To observe the general z-score trend present for each shuffling technique, a moving average for every 120 points is plotted as a line against genomic position as well; where green and blue coloring refers to mononucleotide and dinucleotide shuffling, respectively. (B) The same data from above is plotted here as whisker plot: center lines indicate the median; crosses indicate the mean; the box limits indicate the 75th and 25th percentiles; whiskers extend to 1.5 times the interquartile range; outliers are represented as dots.

