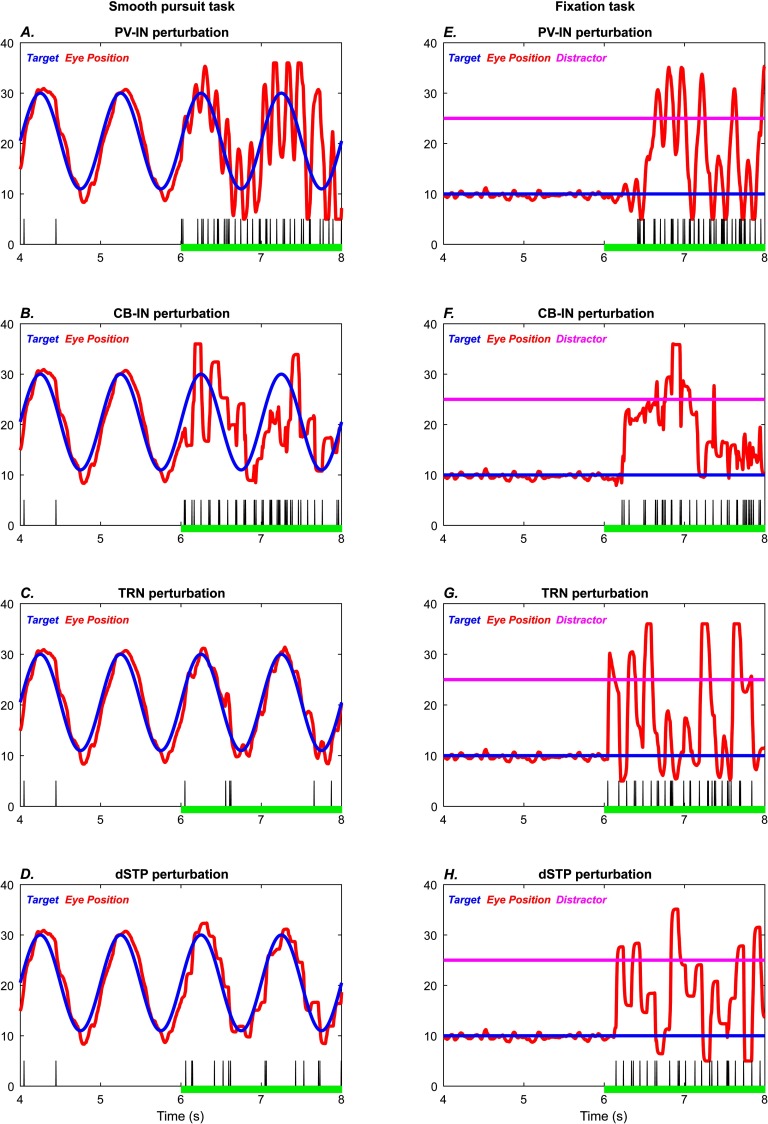
Figure 7. .
Comparison of eye movements across perturbations. Behavioral performance for samples of each type of simulated perturbation, zooming in on the final 4 s of each simulation. The plots on the left (A–D) show the smooth pursuit task, and the plots on the right (E–H) show the fixation task. Blue traces, target; red traces, eye position; magenta traces (straight lines), distractor. Vertical black tick marks indicate temporal locations of “saccade-like” high-velocity movement bursts. The perturbations of PV-INs (A, E), CB-INs (B, F), TRN neurons (C, G), and short-term plasticity (D, H) take place from the 6 s mark onward (green bar). They show broad qualitative similarities, but the detailed performance profiles show differences.

