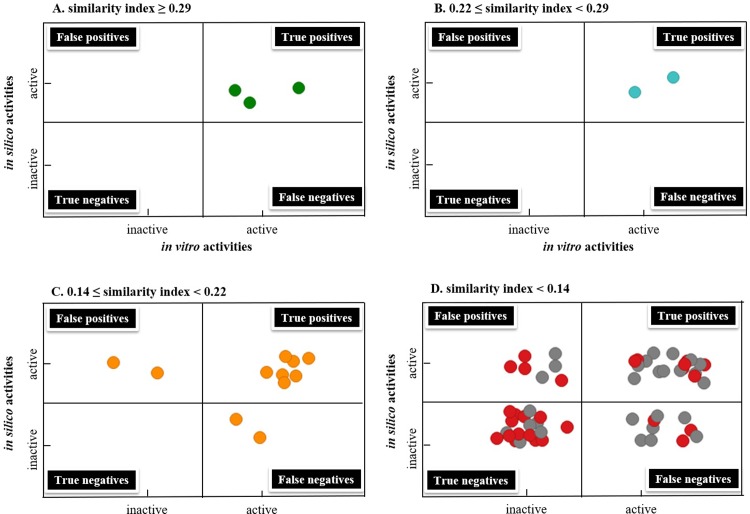
Fig 7.
The performance of pharmacophore-based 3D QSAR modeling results in comparison to in vitro activities, when the similarities of the binary fingerprint between the query compound and the training/test compounds are ≥ 0.29 (A), between 0.22 to 0.29 (B), between 0.14 and 0.22 (C), and < 0.14 (D). In D, red dots indicated that similarity ranges between 0.10 to 0.14; grey dots indicated that similarity was below 0.10.

