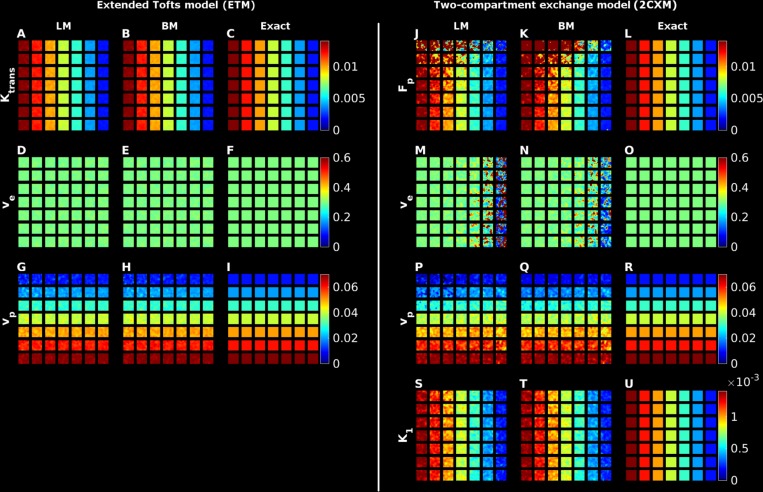
Fig 1.
Illustrations of parameter plots using the Bayes or LM method for the extended Tofts model (panels A to I) and the two-compartment exchange correlation model (panels J to U). Each row in the two model panels represents a given parameter. The first two columns for each row represent the BM and LM parameter estimates, while the third column present the ground truth parameter map (denoted ‘Exact’ in the figure).

