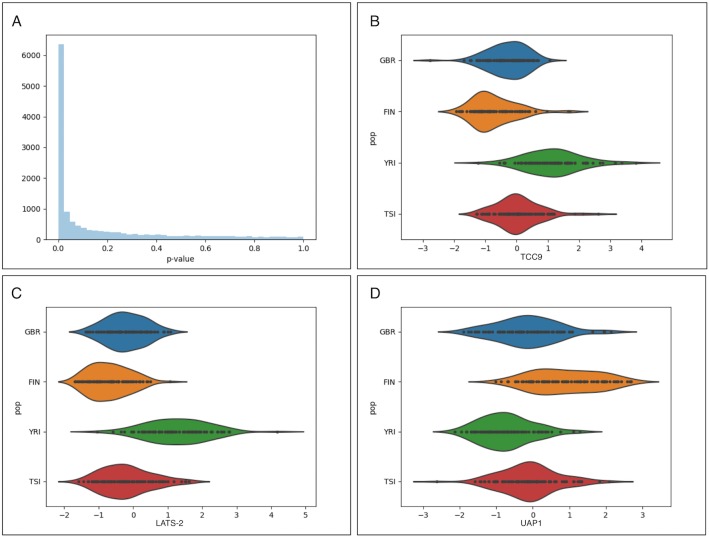
Fig 3. Visualizing important genes.
(A) The p-value distribution for tests that the variance of each gene in the projection is greater than the null shows a large number of genes with significant scores in the PCCA projection. The expression distributions by population for the three genes with highest z-scores are shown in (B) the LATS-2 gene, (C) the EIF4EBP2 gene, (D) the STX7 gene.

