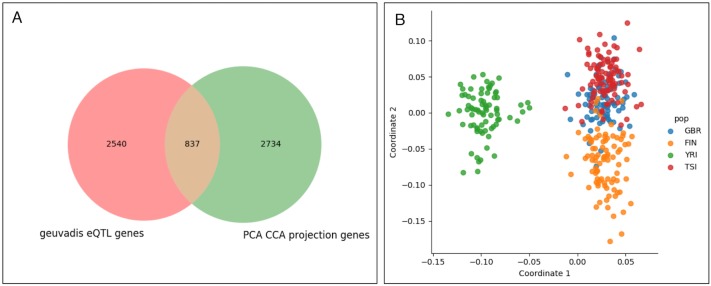
Fig 4. Comparison to GEUVADIS results.
(A) A Venn diagram showing the overlap between GEUVADIS eQTL genes and genes that significantly influence the PCCA projection, showing that 837 of the PCCA genes were determined to be eGenes in the GEUVADIS analysis. (B) Removing the population mean effect of the lead eQTL SNP for all GEUVADIS eGenes has no perceptible effect on the PCCA projection. In this case, the first two canonical correlations are 0.966 and 0.803.

