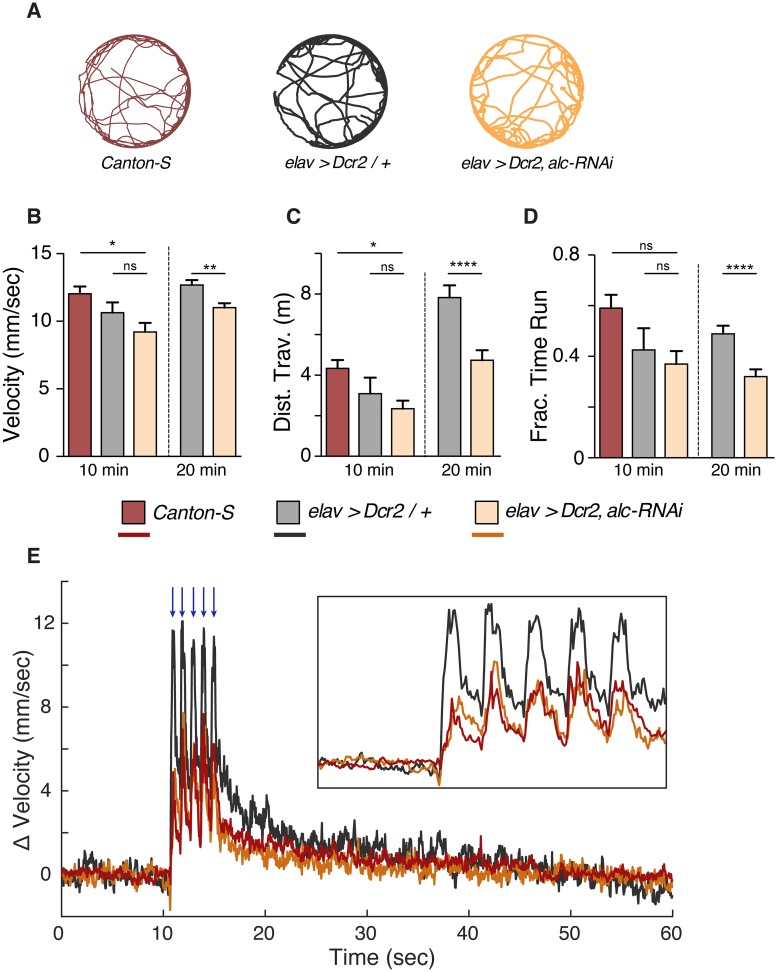
Fig 6. Knockdown of alc/AMPKβ in the nervous system does not result in hyperactivity or hypersensitivity.
(A) Example tracks of individual animals over a 10-minute recording period. (B-D) Graphs showing average running velocity (>2mm/sec) (B), total distance traveled (C), and fraction of time moving (velocity > 2 mm/sec) (D) for Canton-S, elav>Dcr-2/+, and elav>Dcr-2, alc-RNAi animals for a 10 minute (n = 10) and 20 minute recording period (n = 30). Error bars indicate SEM. Mann Whitney or Kruskal-Wallis test with Dunn’s post-hoc testing was used to determine statistical significance: ***p<0.001, ****p<0.0001, versus the control. (E) Average baseline subtracted velocity for Canton-S, elav>Dcr-2/+, and elav>Dcr-2, alc-RNAi animals centered on delivery of a five pulse mechanical stimulus (blue arrows). Inset box shows a magnified view of the response. N = 80 animals for each genotype and data averaged over five pulse trains separated by 60 seconds.

