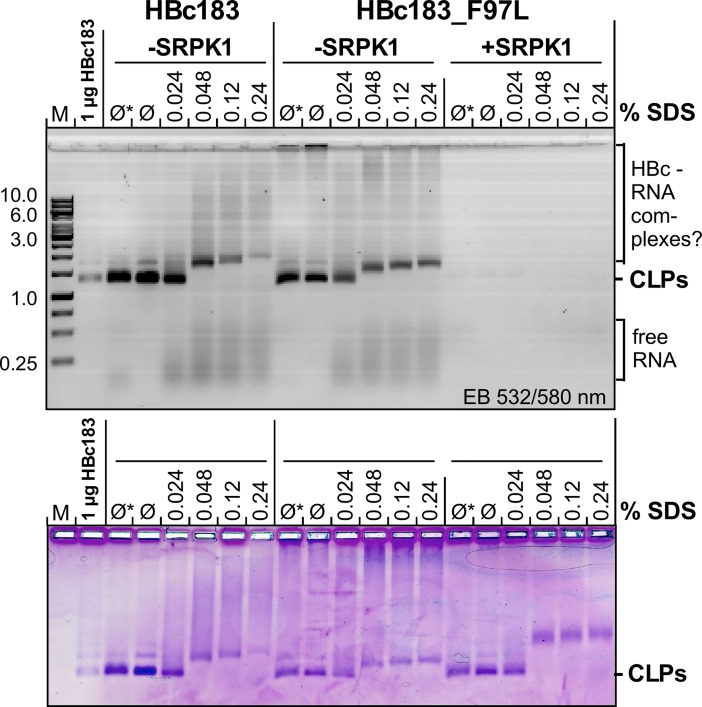
Fig 6. Little impact on SDS sensitivity of CLPs by high phosphorylation, low RNA content and F97L mutation.
About 5 μg HBc protein from the indicated CLP preparations were directly loaded (Ø), or after 30 min incubation in non-denaturing 6x DNA loading buffer (Ø*) or in SDS-containing DNA loading buffer (NEB Purple) at the indicated final SDS concentrations, then analyzed by NAGE. A 1 kb DNA ladder (M) plus 1 μg of untreated HBc183 CLPs served as markers. EB fluorescence signals (top) were recorded using a laser scanner (excitation 532 nm/O580 nm filter). Proteins were subsequently stained by CB. In all samples the intact CLP bands became fuzzier at 0.024% SDS compared to the untreated controls, and a distinct upward mobility shift occurred at 0.048% SDS. For the non-phosphorylated CLPs (-SRPK1) this was accompanied by visible release of RNA.

