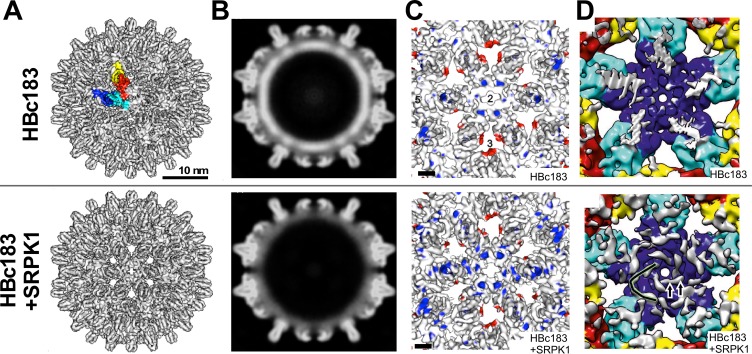
Fig 8. CryoEM comparison between non-phosphorylated and seven-fold CTD-phosphorylated HBc183 CLPs.
(A) Surface representations from image reconstructions at 7.8 Å and 7.9 Å resolution. The A, B, C, and D monomers of one asymmetric unit in the T = 4 HBc183 CLP are colored blue, cyan, red and yellow. (B) Density representations of equatorial slices. Non-phosphorylated HBc183 CLPs display an unstructured shell of high density underneath the inner surface (top) which was absent from the SRPK1 coexpressed particles (bottom) with their much lower RNA content. (C) Impact of seven-fold phosphorylation and/or low RNA content on the structure of the assembly domain. The surface representations show close-ups of the two-fold symmetry axes at 7.8 Å and 7.9 Å resolution, sharpened with B-factors of -797 Å2 and -979 Å2, respectively. For clarity densities at radii <127 Å and small disconnected speckles were removed. Surface coloring reflects differences between the normalized unsharpened maps. Only differences with a confidence level of >99% (Student´s t-test) are shown. Colored areas highlight extra densities in non-phosphorylated (red) and phospho-HBc CLPs (blue). The length of the scale bar equals 2 nm. Numbers 2, 3 and 5 indicate the respectice symmetry axes. (D) Ordered internal protein density in seven-fold phosphorylated HBc183 CLPs. Shown are luminal close-ups of the five-fold symmetry axes; density accounted for by modelling the crystal structure of HBc149 CLPs (pdb: 1QGT) into the reconstructions is color-coded as in (A); not accounted for density is shown in white. Note the tube-like structures extending all the way to the feet of the spikes (one of the five highlighted as black continuous line) in the phospho-HBc CLPs. The extensions appear in direct contact with R112, part of the inner CLP lining (S11B Fig).

