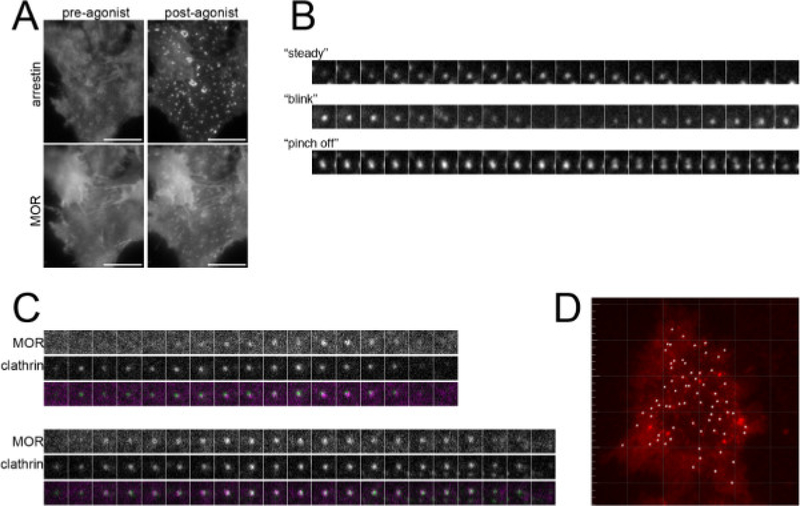
Figure 3: Visualizing and Quantifying Endocytic events in TIRF.
(A) A cell expressing the μ-opioid-receptor (MOR) and β-arrestin before and after addition of an agonist that induces endocytosis. The agonist causes redistribution of both proteins to endocytic puncta. Scale bar is 10 μm. (B) Three types of endocytic events, seen by visualizing arrestin dynamics, consistent with previously described morphologies. “Steady”, one steady signal that rapidly disappears. This is the main type, indicating that the CCP has budded and left the TIRF field. “Blink”, a signal that blinks to a lower signal and reappears at the same spot due to assembly of a second CCP at the same spot. “Pinch off”, a tubular projection comes off a spot, when two CCPs are too close to each other to be resolved as distinct spots, and one is endocytosed. The box is 2 × 2 μm. (C) Visualizing clathrin-mediated endocytosis of MOR at single-event resolution. Two examples that represent the major fraction of MOR endocytic events are shown. Frames are every 3 sec. The box is 2 × 2 μm. (D) Detection of individual endocytic events using Imaris. White spheres denote CCPs detected as Spots. Spot detection was optimized using a “Quality” filter. Dimmer spots that could not be detected for the entirety of their lifetimes were also excluded with the quality filter. Large plaque structures that are shown as being undetected were omitted using an “Intensity” filter. Please click here to view a larger version of this figure.

