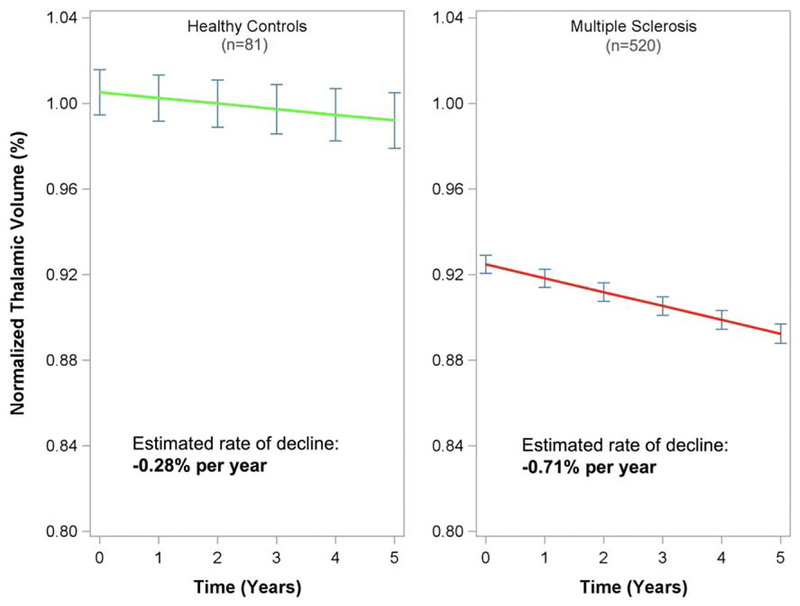
FIGURE 1:
Normalized thalamic volume decline from a linear mixed effects model including both healthy controls (green line, left panel) and multiple sclerosis subjects (red line, right panel) is shown. Point estimates of normalized thalamic volume at each year ±95% standard error (blue error bars) are shown.

