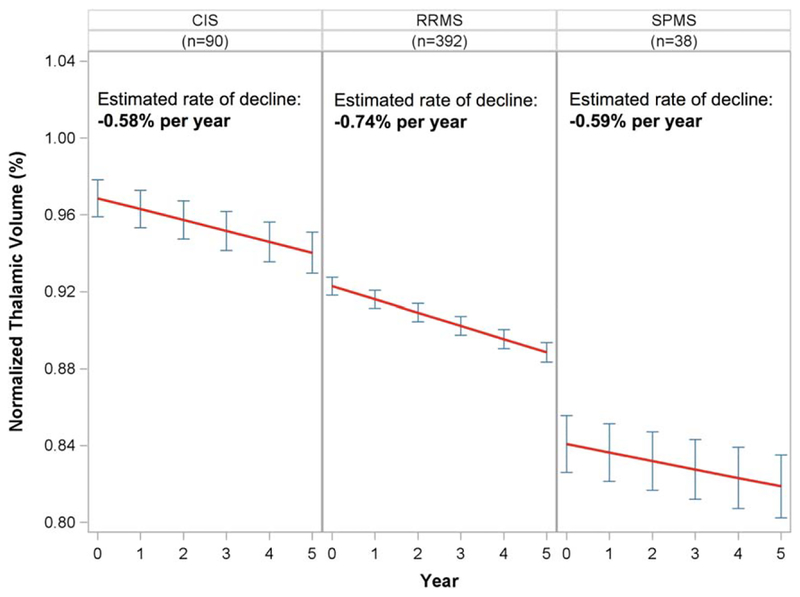
FIGURE 3:
Normalized thalamic volume by clinical subtypes at baseline. Estimated decline in each subtype from linear mixed effects models is shown (red lines), with point estimates of normalized thalamic volume±95% standard error at each year (blue error bars). CIS=clinically isolated syndrome; SPMS=secondary progressive multiple sclerosis; RRMS=relapsing–remitting multiple sclerosis.

