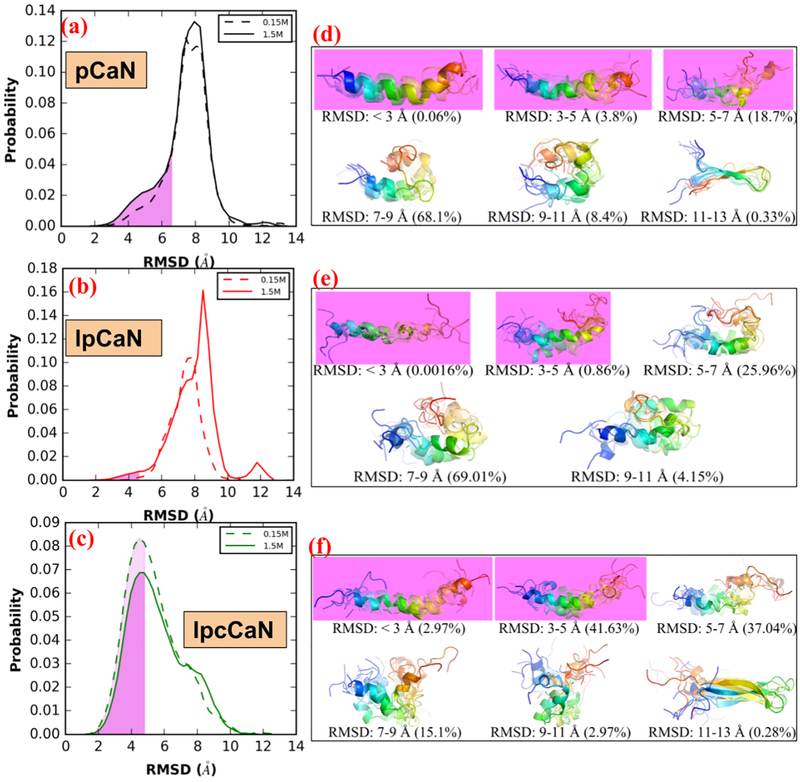
Figure 3:
Distribution of RMSD (with respect to bound-pCaN crystal structure in PDB 4Q5U) in the MD of each CaN peptide at 0.15 M ionic strength and 1.5M ionic strength, respectively(a-c). The shaded area colored in violet denotes the open state-like conformation. The representative structures (colored in rainbow with N-termini as blue and C-termini as red) for each RMSD range and percentage of conformations within this RMSD range were also shown(d-f).

