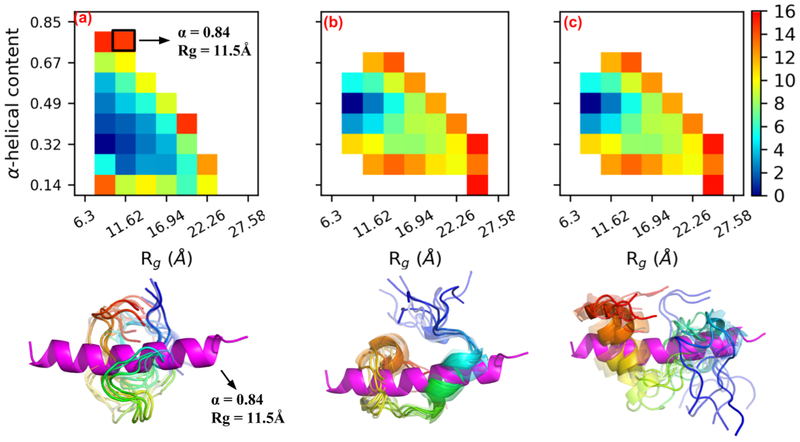
Figure 4:
Two dimensional PMFs for pCaN (a), lpCaN (b) and lpcCaN (c) at 0.15 M ionic strength. The x and y axis depict α-helical and Rg reaction coordinates, respectively. The x axis of (b) and (c) are hidden for clarity. For each peptide, ten randomly selected structures (colored in rainbow with N-termini as blue and C-termini as red) from lowest energy area are compared against bound state pCaN conformation (colored in magenta) from PDB 4Q5U (α = 0.844, Rg = 11.54 Å). The unit of color bar is kbT where kb is Boltzmann constant and T = 298 K is temperature.

