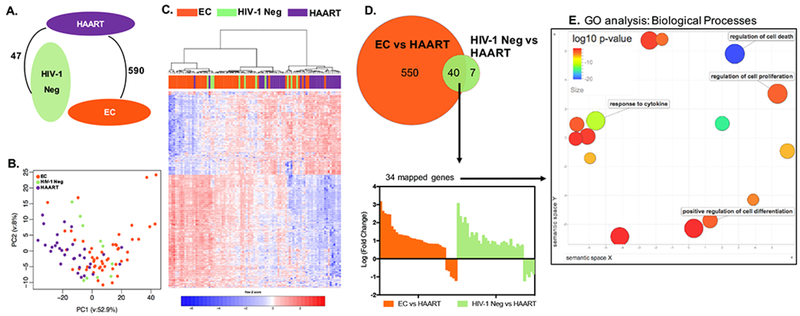
Figure 1: Distinct transcriptional signatures of CD8+ T cells from HIV-1 EC.

(A) Number of differentially expressed genes between EC, HIV-1 negative (labeled as HIV-1 Neg in all figures), and HAART-treated patients (FDR-adjusted p<0.05 and fold change >1.5). There was no significant transcriptional difference between CD8+ T cells from EC and HIV-1 negative persons in this analysis. (B) Principal Component Analysis (PCA) of the transcriptional profiles of CD8+ T cells from EC, HIV-1 negative, and HAART-treated patients. (C) Heat map reflecting 597 differentially expressed transcripts between CD8+ T cells from EC, HIV-1 negative, and HAART treated patients. The differentially expressed transcripts were chosen from 5377 transcripts that were significantly expressed in at least 95% of the samples. (D) Upper panel: Venn diagram depicting the differentially expressed transcripts between EC vs HAART-treated patients (orange circle) and HIV-1 negative vs HAART-treated individuals (green circle). Lower panel: Bar diagram reflecting directional transcriptional differences of 34 mapped genes distinguishing HAART-treated persons from EC and HIV-1 negative persons. (E) Gene ontology (GO) analysis of the 34 differentially expressed genes selected in (D). The plot generated using REVIGO reflects clustering of semantic similarities between GO terms of Biological Processes as determined by DAVID. Color coding corresponds to log10 (p-value) of GO terms in differentially expressed genes, also determined using DAVID. Terms with high functional relevance for CD8+ T cell biology are highlighted.
